• About WordPress
    • WordPress.org
    • Documentation
    • Learn WordPress
    • Support
    • Feedback
  • Log In
  • Skip to primary navigation
  • Skip to main content
  • Skip to primary sidebar
  • Home
  • Contact us
  • Related Sites
    • InflationData.com
    • Financial Trend Forecaster
    • Your Family Finances
    • Elliott Wave University
    • Optio Money
  • About
    • Terms of Use
    • Disclaimer & Disclosure
    • Privacy Statement
  • Sitemap
    • 2009-2010 Posts
    • 2011 Posts

UnemploymentData.com

Your Source for Employment and Unemployment Data

Unemployment
  • Charts
    • Current Unemployment Rate Chart
    • Current Employment Rate (Chart and Data)
    • Current Employment vs Unemployment Chart
    • Historical Employment Data
    • Employment Population Ratio
    • Misery Index
  • Unemployment
    • Historical Unemployment Rate Tables
    • What Is U-6 Unemployment?
    • Unadjusted vs. Seasonally Adjusted U-3 Unemployment Rate
    • BLS vs. Gallup Unemployment Numbers
    • Current U-6 Unemployment Rate
    • What is the Labor Force Participation Rate?
    • What is the Real Unemployment Rate?
  • Employment
    • Current Employment Rate (Chart and Data)
    • Historical Employment Data
    • Contacting a Live Person at the State Employment Commission
      • How to Talk to a Live Person at the Virginia Unemployment Commission
      • Florida’s FLUID Unemployment Program
    • Benefits
      • Insurance
      • Retirement
    • Careers
    • Employment Costs
    • Experience
    • Government
    • Job Hunting
      • Interview
      • Resume
  • Find Articles
  • Education
    • Skills
  • General
    • Small Business
      • Outsourcing
    • Success
You are here: Home / Archives for July Unemployment

July Unemployment

July 2023 Unemployment Down

August 5, 2023 by Tim McMahon

The U.S. Bureau of Labor Statistics (BLS) released its employment / unemployment report for July on August 4th 2023.

Adjusted Unemployment down Slightly

Current Seasonally Adjusted Unemployment

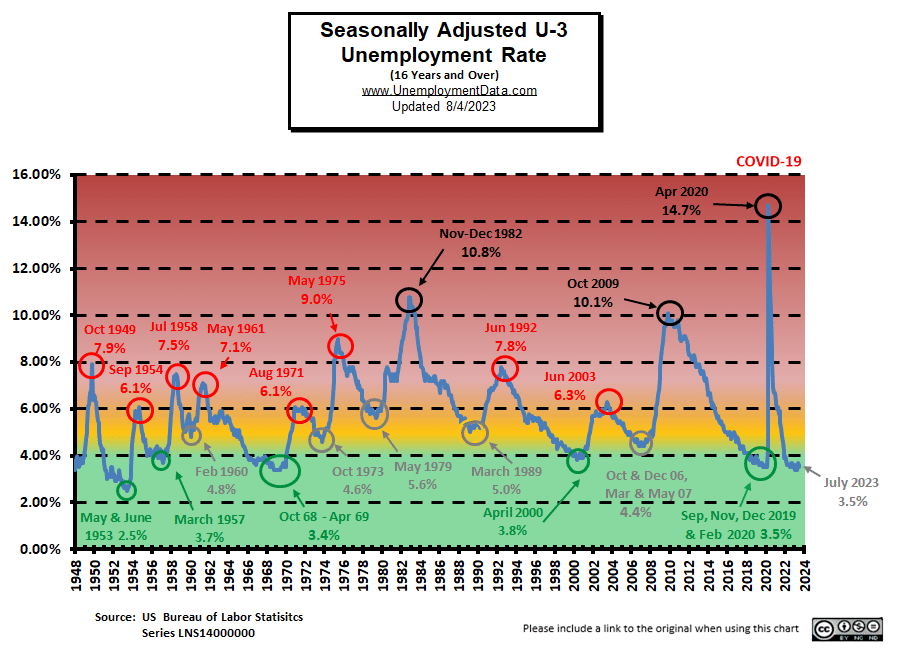
  • Adjusted U-3 was 3.5% down from 3.6%
  • Unadjusted U-3 was 3.8% unchanged
  • Unadjusted U-6 was 7.1% down from 7.2%
  • Labor Force Participation unchanged at 62.6%
  • Unadjusted Employment fell from 156.945 to 156.126 million

Summary:
Despite the fact that the adjusted U3 unemployment rate was down, and they claim more people were working
there were actually fewer people working in July than in June.
Total Employed went down from 156.945 million in June to only 156.126 million in July.

According to the Commissioner of the U.S. Bureau of Labor Statistics:

“Total nonfarm payroll employment rose by 187,000 in July, and the unemployment rate changed little at 3.5 percent, the U.S. Bureau of Labor Statistics reported today. Job gains occurred in health care, social assistance, financial activities, and wholesale trade.”

You can read the full BLS report here.

As usual, they are talking about “Seasonally Adjusted Jobs”.

Looking at the Unadjusted Employment Statistics Program (Formerly the Establishment Survey report) we see…
Originally the BLS reported employment of 155.963 million for June, which they adjusted to 156.945 million. So they subtracted 18,000 jobs for June. They are reporting 156.126 million jobs for July which is actually a decrease of 837,000 jobs based on their original estimates or a decrease of 819,000 based on their updated numbers. 

BLS Source

Current Employment Rate Chart

Adjusted Unemployment is at the pre-COVID 2019 cyclical lows of 3.5%. We’ve been saying that “typically, March or April has one of the lowest unemployment rates for the year, so we could see a slight increase from here without an actual deterioration of the labor market.”  And that is what happened before dropping slightly in July.  Current levels are still within the “Green Zone”.

Seasonally Adj U-3 Unemployment Rate 8-23

[Read more…] about July 2023 Unemployment Down

Filed Under: BLS Tagged With: ADP, BLS, employment, July Unemployment

Primary Sidebar

Search Site

Sponsored:

URGENT: These Stocks Stand Poised to Benefit from President Trump's Trade Wars!

As the Trump administration moves ahead with aggressive tariff policies on key imports, the mainstream media is scrambling.

This Free Report - which you can download now - reveals the names and ticker symbols of 5 Stock Poised to Benefit Most from President Trump's Tariff Wars.

Click Here to Download Your FREE Stock Report Now.

Recent Posts

  • April 2025 Employment / Unemployment Report
  • Would More Jobs Help Social Security?
  • March 2025- Employment / Unemployment Report
  • February 2025 Jobs Report
  • January 2025 BLS Employment Report

Resources

  • Bureau of Labor Statistics Current Population Survey Monthly survey of households conducted by the Bureau of Census for BLS. It provides data on the labor force, employment, unemployment, etc.
  • Capital Professional Services Providing web design and development and Internet marketing services
  • Elliott Wave University Using the Elliott Wave Principle to improve investment performance
  • Financial Trend Forecaster Featuring Moore Inflation Predictor, NYSE Rate of Change and NASDAQ Rate of change
  • InflationData.com Inflation calculators, databases, etc.
  • Intergalactic Web Designers Web design and development services
  • Your Family Finances

Articles by Category

Articles by Date

Disclaimer

At UnemploymentData.com we are not registered investment advisors and do not provide any individualized advice. Past performance is not necessarily indicative of future performance and future accuracy and profitable results cannot be guaranteed.

Privacy & Terms of Use

Privacy Statement & Terms of Use

Do Not Sell My Information

Copyright © 2025 · News Pro on Capital Professional Services, LLC. All rights reserved · Log in