
Typically July Jobs Reports aren’t that great anyway so “Seasonal Adjustments” correct for that but let’s dig a bit deeper today.
![]()
- Adjusted U-3 was Down from 3.6% in June to 3.5% in July.
- Unadjusted U-3 was Unchanged at 3.8% for June and July after being 3.4% in May.
- Unadjusted U-6 went from 6.7% in May to 7.0% in June to 7.2% in July.
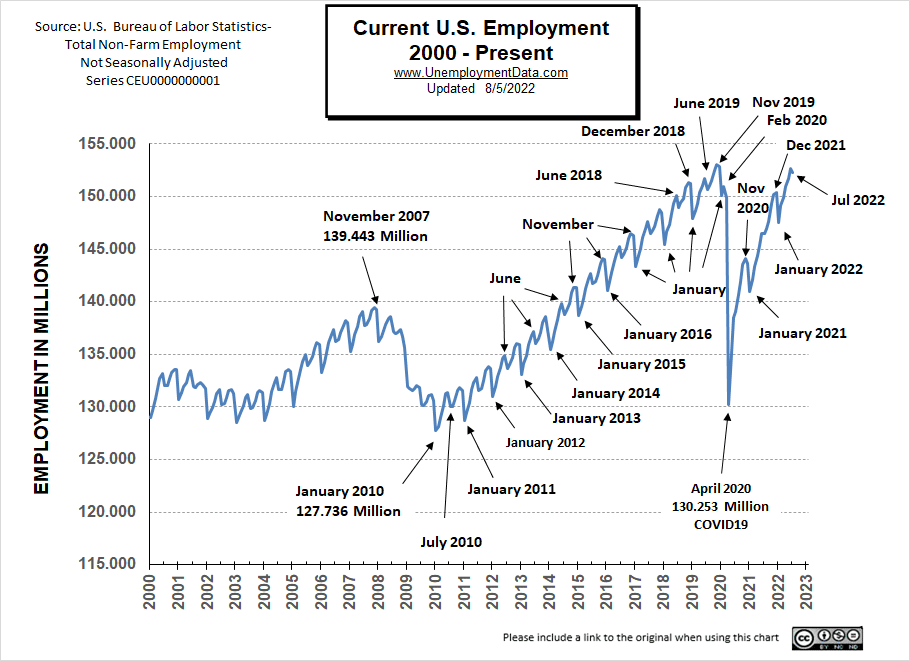
- Unadjusted Employment FELL from 152.634 million to 152.249 million.
- Average Weekly Wages Still Rising
Looking Back:
Last month (for June) we reported the following “Early Indicators of a possible recession”
- Labor Force Participation Down from 62.3% to 62.2%
- Upturn in Uneducated Unemployment
- Rising Unemployment among the newly unemployed
- Average Weekly Hours among manufacturing workers falling
July’s Indicators
According to CNBC:
“Hiring in July was far better than expected, defying multiple other signs that the economic recovery is losing steam, the Bureau of Labor Statistics reported Friday.”
One of those “other signs” is the two consecutive quarters of falling GDP. This is definitely a sign of a slowing economy, but we have typically followed the National Bureau of Economic Research, i.e. NBER’s guidance of when a recession starts. Because that includes a variety of other factors (including unemployment) giving a fuller picture of the total economy, not just GDP. But NBER typically takes a while before they declare that a recession began months ago.
But… one reason the Employment situation is as good as it is, is because of the massive injection of FED funny money over the last two years which artificially boosted the economy.
According to CNN:
“The US economy has now regained all jobs lost during the pandemic, after a blowout July jobs report that showed a gain of 528,000 jobs, according to data released Friday by the Bureau of Labor Statistics. The massive monthly gain was more than double the 250,000 that economists were expecting, according to Refinitiv.”
According to the Commissioner of the U.S. Bureau of Labor Statistics:
“Nonfarm payroll employment increased by 528,000 in July, and the unemployment rate edged down to 3.5 percent. Job growth was widespread, led by gains in leisure and hospitality, professional and business services, and health care. In July, both total nonfarm employment and the unemployment rate returned to their February 2020 pre-pandemic levels. Private-sector employment is 629,000 higher than in February 2020, although several sectors have yet to recover. Government employment is 597,000 lower than its pre-pandemic level.”
You can read the full BLS report here.
As usual, they are talking about “Seasonally Adjusted Jobs” from the “Household Survey” rather than looking at the results reported by actual companies in the BLS “Establishment Survey”.
But looking at the Establishment Survey report we see…
Originally the BLS reported employment of 152.692 million for June which they adjusted this month down to 152.634 million. So, 58,000 jobs disappeared for June. So even if they just reported the same number as they originally did in June we would have a 58,000 job increase!
Now they are reporting 152.249 million jobs for July which is actually a decrease of 443,000 jobs based on their original estimates or a decrease of 385,000 based on their updated numbers. So employment is actually down, unadjusted U6 is UP, Unadjusted U3 is UP, and LFPR is Down, but somehow this is presented as a rosy report.
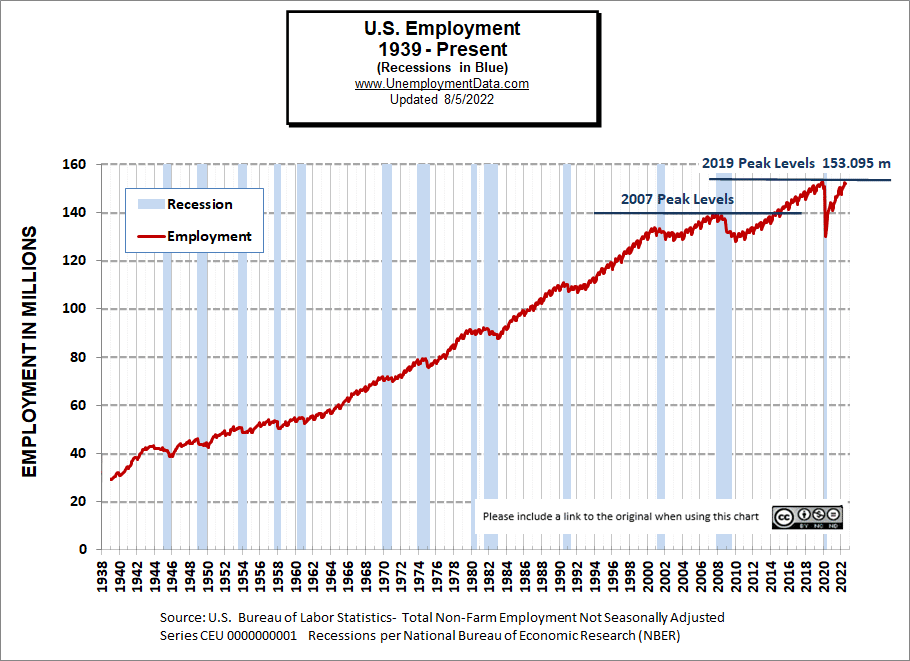
The other factor in their rosy outlook is that employment is now back to pre-covid levels. But when we look at the Establishment Survey numbers we see that February 2020 (pre-covid) at 150.968 million is actually below the November 2019 peak of 153.095 million. So the current 152.249 million is still below the 2019 peak, and that doesn’t even count the roughly 4 million increase in documented population plus the untold millions of new “undocumented” residents.
Historical Employment with Recessions
[Read more…] about July 2022 Jobs Report- Not as Rosy as They’d Have You Believe