• About WordPress
    • WordPress.org
    • Documentation
    • Learn WordPress
    • Support
    • Feedback
  • Log In
  • Skip to primary navigation
  • Skip to main content
  • Skip to primary sidebar
  • Home
  • Contact us
  • Related Sites
    • InflationData.com
    • Financial Trend Forecaster
    • Your Family Finances
    • Elliott Wave University
    • Optio Money
  • About
    • Terms of Use
    • Disclaimer & Disclosure
    • Privacy Statement
  • Sitemap
    • 2009-2010 Posts
    • 2011 Posts

UnemploymentData.com

Your Source for Employment and Unemployment Data

Unemployment
  • Charts
    • Current Unemployment Rate Chart
    • Current Employment Rate (Chart and Data)
    • Current Employment vs Unemployment Chart
    • Historical Employment Data
    • Employment Population Ratio
    • Misery Index
  • Unemployment
    • Historical Unemployment Rate Tables
    • What Is U-6 Unemployment?
    • Unadjusted vs. Seasonally Adjusted U-3 Unemployment Rate
    • BLS vs. Gallup Unemployment Numbers
    • Current U-6 Unemployment Rate
    • What is the Labor Force Participation Rate?
    • What is the Real Unemployment Rate?
  • Employment
    • Current Employment Rate (Chart and Data)
    • Historical Employment Data
    • Contacting a Live Person at the State Employment Commission
      • How to Talk to a Live Person at the Virginia Unemployment Commission
      • Florida’s FLUID Unemployment Program
    • Benefits
      • Insurance
      • Retirement
    • Careers
    • Employment Costs
    • Experience
    • Government
    • Job Hunting
      • Interview
      • Resume
  • Find Articles
  • Education
    • Skills
  • General
    • Small Business
      • Outsourcing
    • Success
You are here: Home / Archives for Jobs Data

Jobs Data

Yet Another Month of Questionable Federal Jobs Data as 310,000 Fewer People Report Having Jobs

June 5, 2023 by Ryan McMaken

The Bureau of Labor Statistic (BLS) released new jobs data on Friday. According to the report, seasonally adjusted total nonfarm jobs rose 339,000 jobs in May, well above forecasts. The unemployment rate rose slightly from 3.4 percent to 3.7 percent (month over month).

Headlines in the mainstream media declared the headline employment data to be evidence of very strong job growth and economic success. According to Politico, the latest jobs numbers are evidence of a “remarkable resilience of President Joe Biden’s economy” and NPR declared the job market to be “sizzling hot.”

Yet, May appears to be yet another month in which it seems nearly every economic indicator except the payroll jobs data points to an economic slowdown. The Philadelphia Fed’s manufacturing index is in recession territory. The Empire State Manufacturing Survey is, too. The Leading Indicators index keeps looking worse. The yield curve points to recession. Even Federal Reserve staffers, who generally take an implausibly rosy view of the economy, predict recession in 2023. Individual bankruptcy filings were up 23 percent in May. Temp jobs were down, year-over-year, which often indicates approaching recession.

So how do we square all this with yet another jobs report that claims to tell us that the job market is the best it’s been in decades?

Well, a lot of the jobs data isn’t actually very good. The headlines have focused on the so-called Establishment Survey which is a survey of employers and shows only the number of positions, not the number of employed persons. The Household survey, on the other hand, surveys people.

The Household survey over the past two years has not shown nearly as much job growth as the Establishment Survey.

Specifically, we find that since 2022, the Establishment Survey and the Household Survey have ceased to follow a similar trend, with a sizable gap forming between the two surveys. In fact, over the past two years, the two surveys show a gap of 2.2 million: Job Growth since Jan 2021

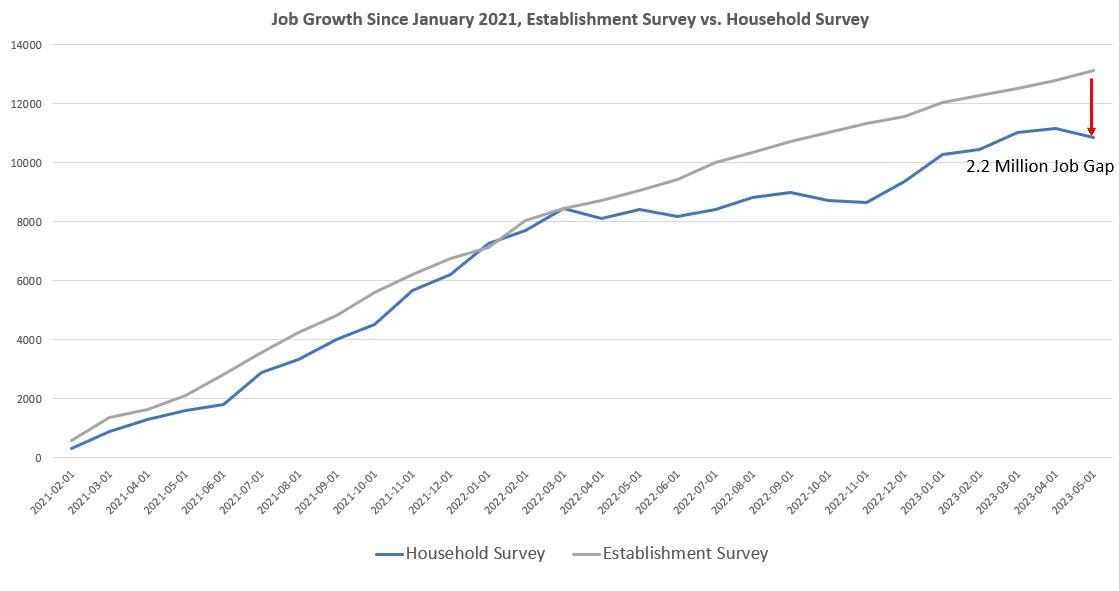
Moreover, in May, while the Establishment Survey showed a gain of 339,000 jobs month-over-month, the Household Survey showed a loss of 310,000 employed persons. That’s a gap of more than 600,000. Looking at month-to-month changes, we can also see how the two surveys have diverged since April 2022. [Read more…] about Yet Another Month of Questionable Federal Jobs Data as 310,000 Fewer People Report Having Jobs

Filed Under: BLS Tagged With: BLS, Jobs Data

May Unemployment Lowest Since 2000

June 2, 2018 by Tim McMahon

Unemployment 3.8%

The U.S. Bureau of Labor Statistics (BLS) released their monthly employment survey results for the month of May on Friday June 1st .

According to the BLS the Seasonally Adjusted U-3 Unemployment Rate is at a new low. Unemployment has been falling and has now reached levels not seen since April of 2000. Current levels are even lower than during the boom of 2006. If they drop another 1/10th of a percent we will have to go all the way back to 1969 to find levels that low.

Many Experts consider this to be the new “Full Employment” level i.e. everyone who wants a job has found one however with the Labor Force Participation rate still well below the average that is debatable.  See Is the U.S. Really at “Full Employment”? for more information.

Key May Employment and Unemployment Numbers

  • Adjusted U-3 Unemployment-   May 3.8% Down from 3.9% in April and 4.1% October – March.
  • Unadjusted U-3 Unemployment-  May 3.6% down from 3.7% in April and  4.1% in March.
  • Unadjusted U-6 Unemployment-   May 7.3% Down from 7.4% in April and from 8.1% in March and 8.6% in February.
  • Employment 149.309 million up from 148.367 million in April and 147.369 million in March.
  • Gallup has discontinued publishing U-6 & U-3 numbers.

See Current Unemployment Chart for more info.

Employment by Sector

The employment “bubble chart” gives us a good representation of how each sector of the economy is doing (employment wise). As we can see from the chart below only one sector is to the left of the zero line this month indicating that all other sectors gained employees  except Utilities which lost -1,100 employees. The big gainers were Education and Health, Professional and business Services, Construction, Leisure and Manufacturing.

Employment by Sector Bubble Chart The biggest gainer was Education and Health Services (bubble furthest to the right) which added 39,000+ jobs, followed by Retail and Professional Services which each gained roughly 31,000 jobs, Leisure gained 21,000 jobs and manufacturing gained another 18,000 on top of consistently high gains for the last few months. Average weekly earnings for all industries increased to $928.74.

(See the table below the chart for average weekly earnings and other details.)

How to read this chart:

Bubbles location on the chart tell us two things:

  • Change in Employment Levels over the most recent month.
  • Average Weekly earnings.
  • The further to the right the bubble the larger the increase in the number of jobs.
  • The higher up on the chart the larger the average salary.

Bubble Size tells us:

  • Total Employment for the sector.
  • Larger bubbles mean more people are employed in that sector.

Employment and Average Weekly Earnings by Industry for All Employees

May  2018, Seasonally Adjusted

Industry Monthly Increase Average Weekly Earnings Employment Level
Total Private Employment 218,000 $928.74 126,336,000
Mining and Logging 4,000 $1,500.09 733,000
Construction 25,000 $1,174.14 7,210,000
Manufacturing 18,000 $1,097.52 12,673,000
Wholesale trade 4,200 $1,189.81 5,954,800
Retail trade 31,100 $579.70 15,970,300
Transportation and Warehousing 18,700 $940.41 5,309,300
Utilities -1,100 $1,689.89 554,400
Information 6,000 $1,418.40 2,775,000
Financial Activities 8,000 $1,303.88 8,559,000
Professional and Business Services 31,000 $1,164.92 20,891,000
Education and Health Services 39,000 $887.70 23,563,000
Leisure and Hospitality 21,000 $413.95 16,281,000
Other Services 13,000 $772.53 5,862,000

[Read more…] about May Unemployment Lowest Since 2000

Filed Under: BLS Tagged With: Bubble Chart, Employment / Population Ratio, Employment by Sector, Jobs Data, Labor Force Participation Rate, LFPR, May Unemployment, U-6, U6, unemployment

Primary Sidebar

Search Site

Sponsored:

URGENT: These Stocks Stand Poised to Benefit from President Trump's Trade Wars!

As the Trump administration moves ahead with aggressive tariff policies on key imports, the mainstream media is scrambling.

This Free Report - which you can download now - reveals the names and ticker symbols of 5 Stock Poised to Benefit Most from President Trump's Tariff Wars.

Click Here to Download Your FREE Stock Report Now.

Recent Posts

  • April 2025 Employment / Unemployment Report
  • Would More Jobs Help Social Security?
  • March 2025- Employment / Unemployment Report
  • February 2025 Jobs Report
  • January 2025 BLS Employment Report

Resources

  • Bureau of Labor Statistics Current Population Survey Monthly survey of households conducted by the Bureau of Census for BLS. It provides data on the labor force, employment, unemployment, etc.
  • Capital Professional Services Providing web design and development and Internet marketing services
  • Elliott Wave University Using the Elliott Wave Principle to improve investment performance
  • Financial Trend Forecaster Featuring Moore Inflation Predictor, NYSE Rate of Change and NASDAQ Rate of change
  • InflationData.com Inflation calculators, databases, etc.
  • Intergalactic Web Designers Web design and development services
  • Your Family Finances

Articles by Category

Articles by Date

Disclaimer

At UnemploymentData.com we are not registered investment advisors and do not provide any individualized advice. Past performance is not necessarily indicative of future performance and future accuracy and profitable results cannot be guaranteed.

Privacy & Terms of Use

Privacy Statement & Terms of Use

Do Not Sell My Information

Copyright © 2025 · News Pro on Capital Professional Services, LLC. All rights reserved · Log in