
The U.S. Bureau of Labor Statistics (BLS) released its employment / unemployment report for April on May 8th.
COVID-19 Shutdowns Send Unemployment Rate Soaring
- Unadjusted U-3 was Up from 4.5% to 14.4%!
- Adjusted U-3 was Up from 4.4% to 14.7%!
- Unadjusted U-6 was Up from 8.9% to 22.4%!
- Labor Force Participation fell from 62.7% to 60.2%.
- Unadjusted Employment down by approx. -19.5 MILLION jobs.
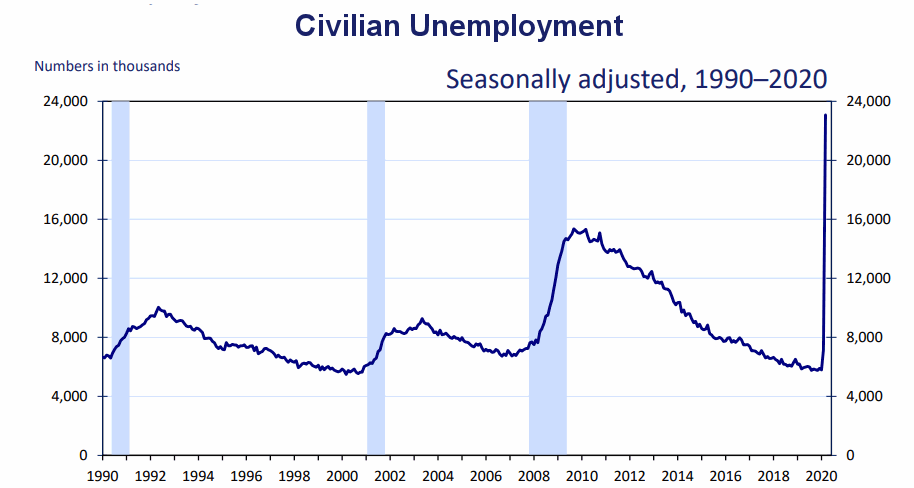
Civilian Unemployment
In April, the ranks of the unemployed swelled by almost 20 million bringing it up to approximately 23 million in total. Rather than looking at percentages, the following chart looks at the actual number of unemployed individuals. The current number of unemployed is considerably higher than at the peak of the 2008-2010 “great recession”.
According to the Commissioner of the U.S. Bureau of Labor Statistics:
Nonfarm payroll employment declined by 20.5 million in April, and the unemployment rate increased to 14.7 percent, reflecting the widespread impact on the job market of the coronavirus (COVID-19) pandemic and efforts to contain it. Employment fell sharply in all major industry sectors, with a
particularly large decline in the leisure and hospitality sector.
The response rate for the household survey continued to be adversely affected by pandemic-related issues, while that for the establishment survey returned to a normal range in April. In addition, there were changes to the estimation methods for the establishment survey to better account for the historic number of temporary or permanent business closures in April. The impacts of the pandemic on the household and payroll surveys are detailed in the April Employment Situation news release and accompanying materials (available on the BLS website)). For both surveys, we were able to obtain estimates that met BLS standards for accuracy and reliability.
The substantial job declines related to the coronavirus pandemic started in March, as payroll employment declined by 870,000, as revised. Job losses accelerated in April, as an additional 20.5 million jobs were lost. These April losses were pervasive across all industry sectors, and brought nonfarm employment to its lowest level since February 2011.
Of course, he is talking about “Seasonally Adjusted Jobs” from the “Current Population Survey (CPS)”
rather than looking at the results reported by actual companies in their “Current Employment Statistics survey (CES)”
Looking at the CES report we see…
Originally the BLS reported 150.804 million jobs for March and then they subtracted 221,000 jobs from that estimate.
So currently they are saying 150.583 million jobs for March and 131.071 million jobs for April which is actually a decrease of -19.733 million jobs compared to what they originally reported last month. Or -19.512 million jobs based on their current estimates of March’s employment.
[Read more…] about Coronavirus Shutdown Causes 20 Million Job Losses