
The U.S. Bureau of Labor Statistics (BLS) released its employment / unemployment report for April on May 5th 2023.
Employment Near All-Time High
![]()
- Adjusted U-3 was 3.4% down from 3.5%
- Unadjusted U-3 was 3.1% down from 3.6%
- Unadjusted U-6 was 6.1% Down from 6.8%
- Labor Force Participation unchanged at 62.6%
- Unadjusted Employment rose from 154.445 million to 155.337 million
According to the Commissioner of the U.S. Bureau of Labor Statistics:
“Total nonfarm payroll employment rose by 253,000 in April, and the unemployment rate changed little at 3.4 percent, the U.S. Bureau of Labor Statistics reported today. Employment continued to trend up in professional and business services, health care, leisure and hospitality, and social assistance.”
You can read the full BLS report here.
As usual, they are talking about “Seasonally Adjusted Jobs”.
Looking at the Establishment Survey report, we see…
Originally the BLS reported employment of 154.517 million for March which they adjusted to 154.445 million. So they subtracted 72,000 jobs for March. They are now reporting 155.337 million jobs for April, which is an increase of 820,000 based on their original estimates or an increase of 892,000 based on their updated numbers.
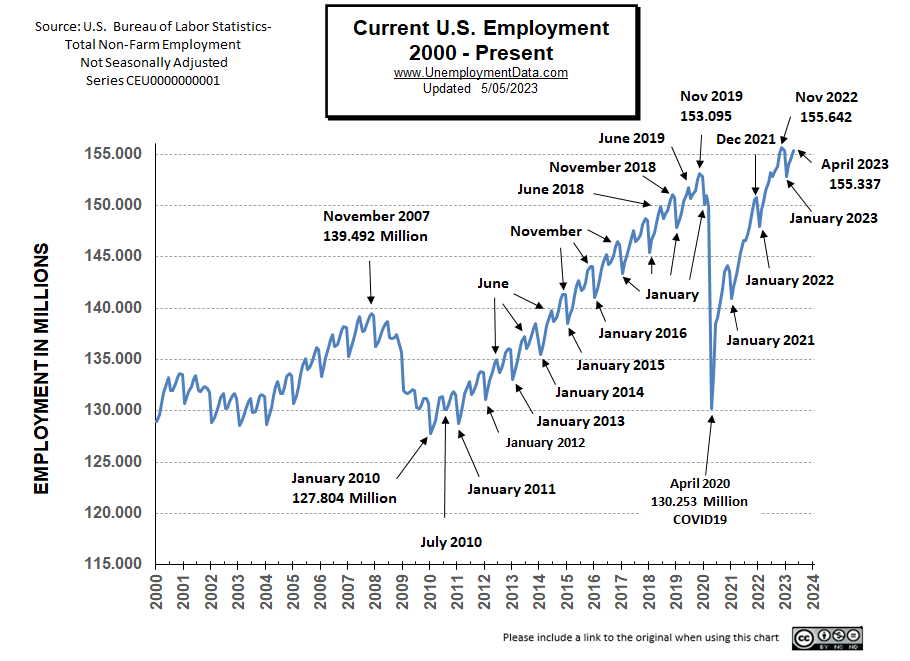
Current Employment Rate Chart
November 2022 had the highest number of people employed in the history of the United States at 155,642,000. Then the typical January slump hit, taking employment down by roughly 3 million. But now employment is once again nearing that high. And if history is any indicator, we can expect employment to peak in June above November’s level before taking another breather. So far, as of April, employment is just a little over 300,000 shy of the all-time high. One way we can tell if the economy is beginning to falter is if the June high doesn’t exceed the previous November, or if November 2023 employment doesn’t exceed June 2023.
 See Current Employment for more info.
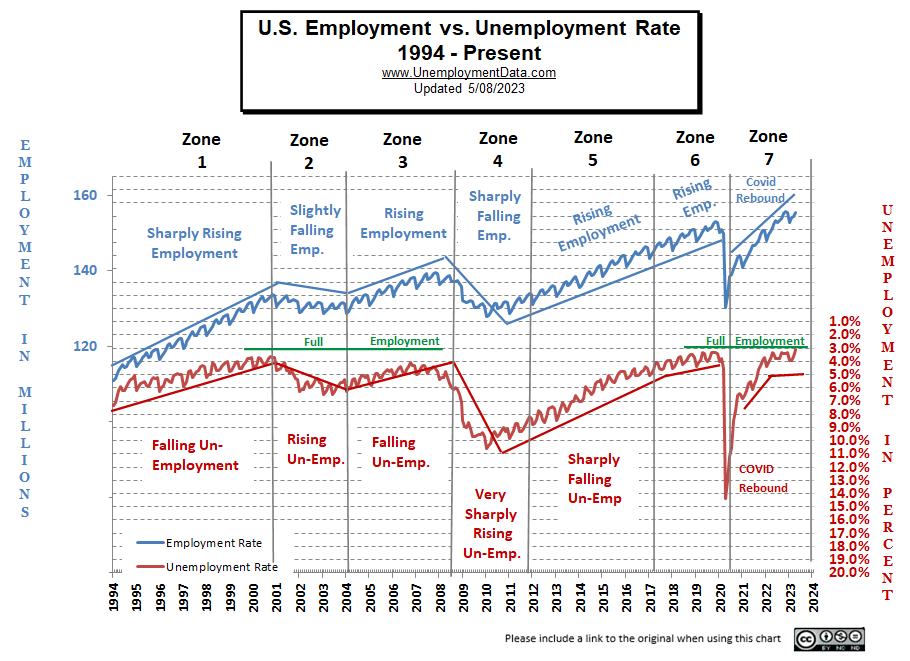
Full Employment?
Last month we said, “Full Employment is when everyone who wants a job has one. It is generally considered to be slightly above 3%. Although, other factors, such as unemployment benefits, can shift the level higher or lower. So, if unemployment benefits are extended from 6 months to 1 year, people will tend to stay unemployed longer, thus raising the unemployment rate.”
The following chart shows four examples of employment continuing to rise, but unemployment flattens out at just over 3%. Currently, the unadjusted unemployment rate is at 3.1%, as close to the theoretical full employment as you can get. Over the next few months, we will see how well reality relates to theory and if unemployment can actually get below 3%.
Note: The Unemployment rate is inverted to track the employment rate, neither is Seasonally Adjusted.
Full employment is not considered to be at zero percent because even when employers are having difficulty finding employees, some people are still unemployed due to either structural unemployment (mismatch between worker skills and job requirements, i.e., not enough training) or simply because they quit their job knowing it would be easy to find another (hopefully better) job. Often referred to as frictional unemployment (there will always be people who have quit or have lost a seasonal job and are in the process of getting a new job). See: Highly Skilled Worker Shortage in a Recession?
If the unemployment rate stays constant, but more people are working, where are these extra workers coming from?
Somehow the workforce has to be growing to accommodate these newly created jobs. They could be long-term unemployed (no longer counted in the workforce) returning to the workforce, they could be immigrants entering the workforce, or possibly retired people coming out of retirement because of an offer too good to turn down. This is generally facilitated by rising wages, but this month’s ADP report indicates that wage growth has slowed, possibly indicating that we are nearing the end of this boom.
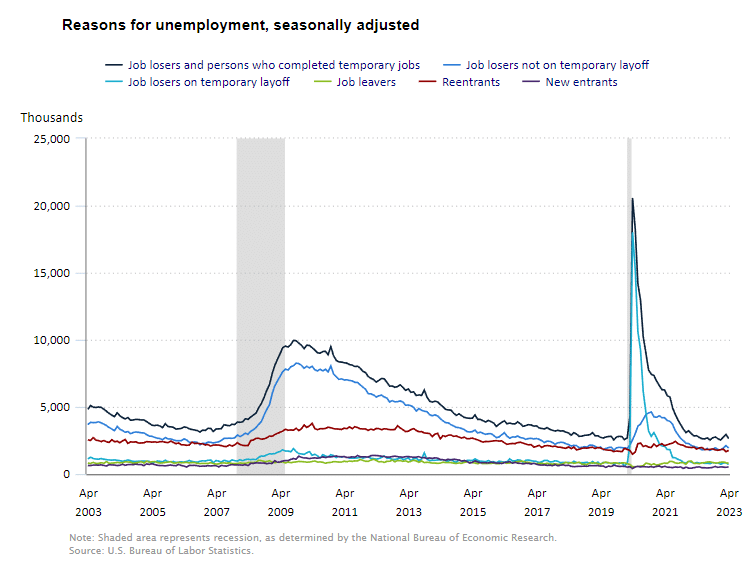
Reasons for Unemployment
As we can see from the following chart, Job losers and persons who completed temporary jobs (black line) always creates some job turnover (i.e. temporary unemployment), although this month the level of turnover decreased somewhat. There is also a steady stream of reentrants, new entrants, and those on temporary layoff.
Duration of Unemployment
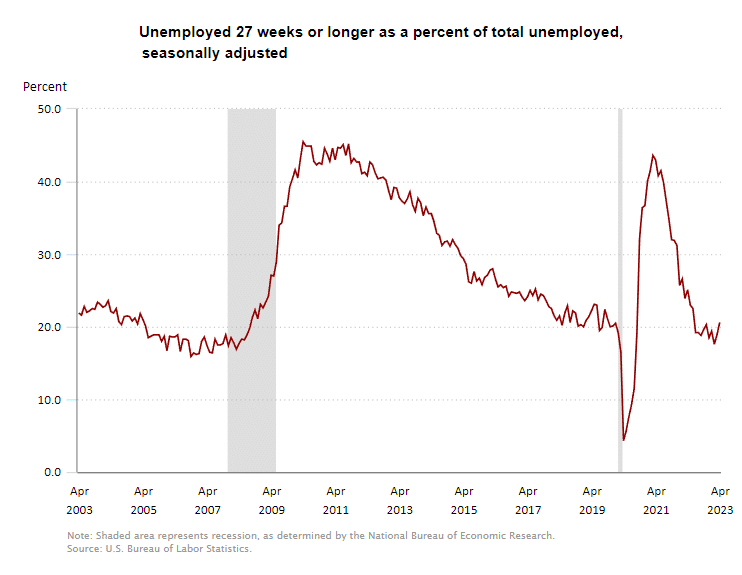
If the duration of unemployment begins climbing, it generally indicates a worsening economic climate. The following chart shows a falling less than 5 weeks of unemployment (which could indicate people are starting to be unemployed for longer times or simply that it is easy to find a new job). 5-14 week unemployment rose slightly, 15-26 week unemployment fell, and 27 weeks and over was relatively unchanged. The trouble starts when 15-26 week unemployment begins rising, followed by longer-term unemployment.
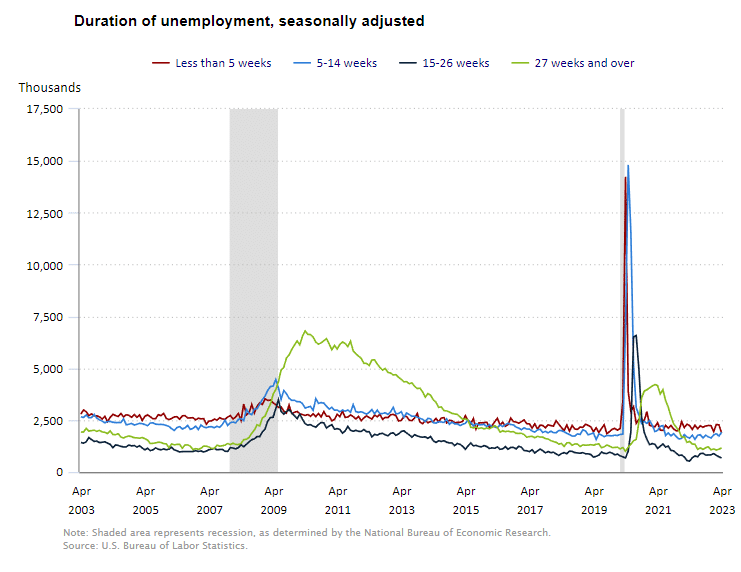 The following chart shows an uptick in the percentage of people unemployed 27 weeks or longer, which could be an early warning indicator.
ADP® National Employment Report
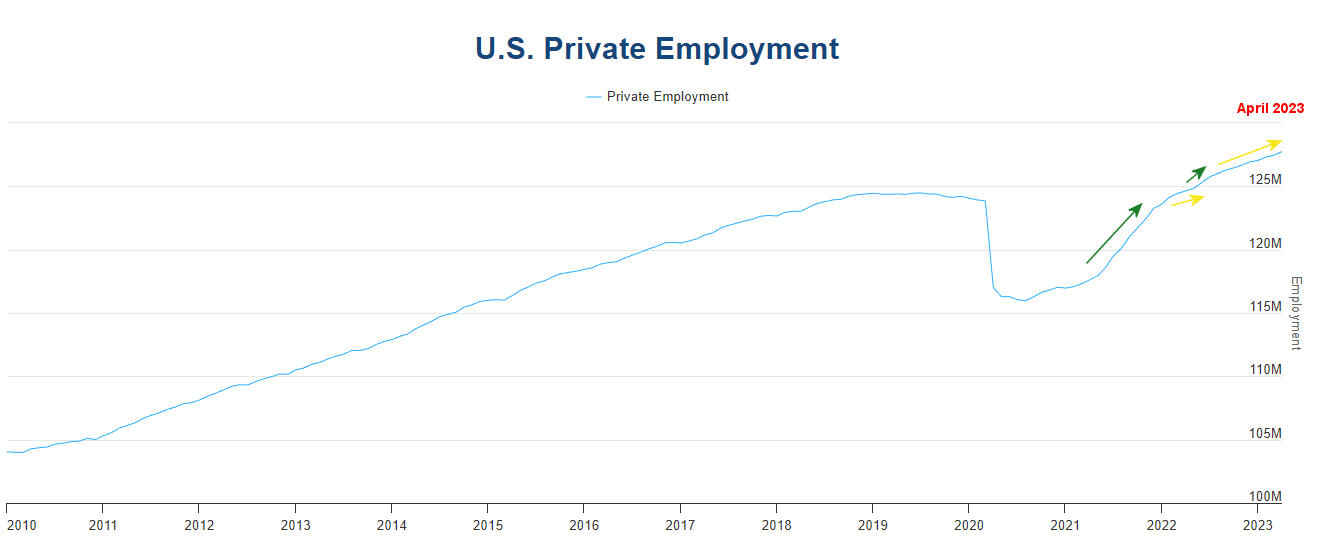
ADP provides an independent (non-government) estimate of private-sector employment and pay, based on data derived from ADP client payrolls. According to ADP®, In collaboration with Stanford Digital Economy Lab, private employment was up in April.
ADP: Private employers added 296,000 jobs in April compared to 145,000 jobs in March.
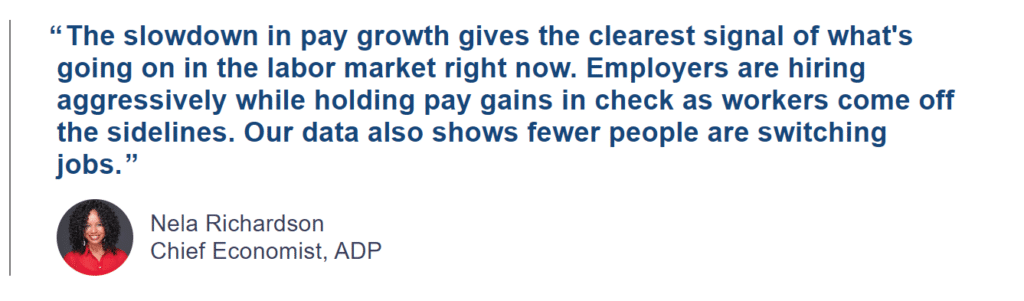
Ms. Richardson is saying that although employers are still hiring, upward pressure on salaries has eased somewhat.
I’ve added some arrows to the ADP private employment chart, to indicate the slope of the line. The long green arrow shows the rapid post-COVID rebound in employment. Then in early 2022, the rate of increase slowed (small yellow arrow). Then around March 2022, the rate of increase picked up again (small green arrow). More recently, the rate of growth has moderated, possibly due to nearing full employment. As long as the slope is upward, the economy is still growing, despite the difficulty in finding qualified employees.
ADP Private Employment by Firm Size
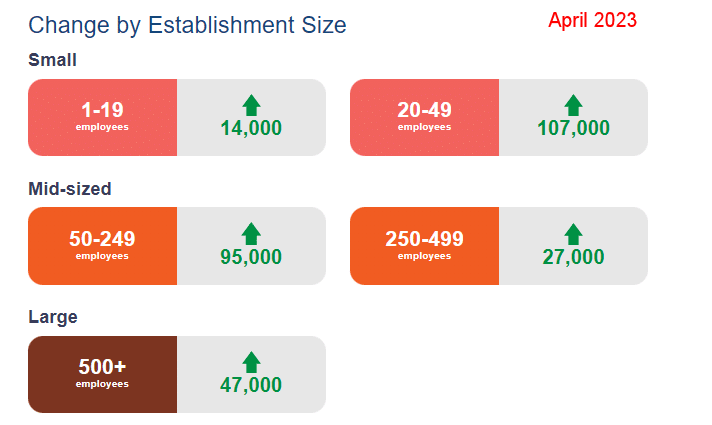
ADP also lists increases by “firm size”.
This month, all-size companies added employees. Last month the only one that decreased was companies with 250-499 employees.
April ADP Changes:
ADP Also Tracks Salary Changes:
As you would expect in a tight labor market, “Job Changers” saw a much greater increase in salary than those who stayed in their job, as companies needed to offer significant increases in order to attract new employees but this month saw a significant decrease in the benefit to changing jobs.
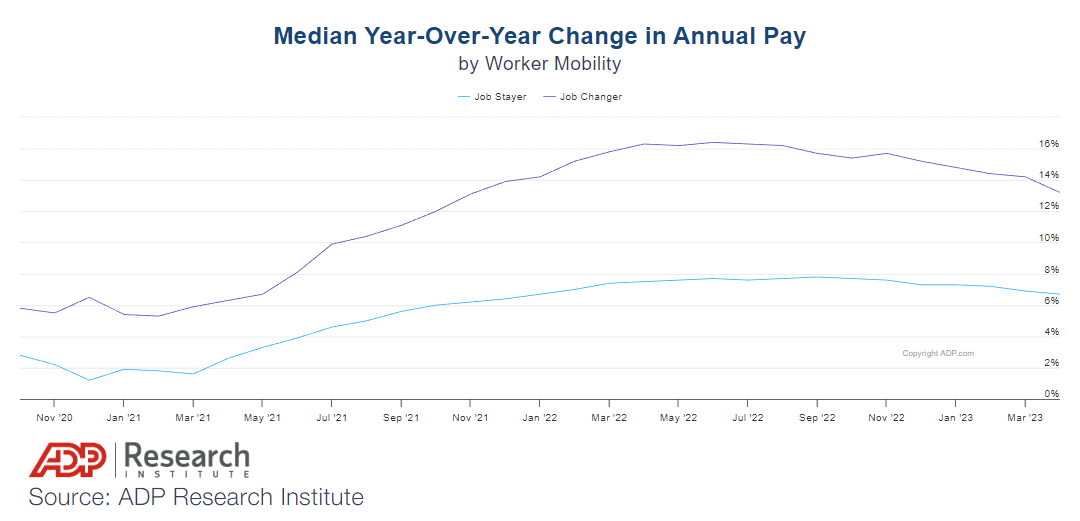
Source: ADP® Pay Insights
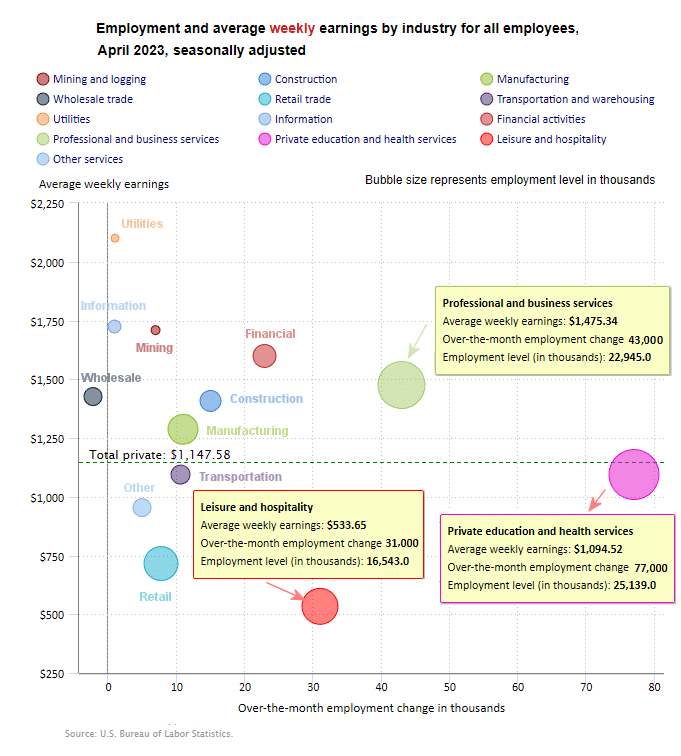
April 2023 Employment by Sector
The employment “bubble chart” is a quick and easy way to see how each sector performs on a seasonally adjusted basis. The Bubble’s Size tells us the total Employment for that industry (i.e., larger bubbles mean more people are employed in that sector).
The bubble’s location on the chart tells us that there has been a change in Employment Levels over the most recent month… A bubble further to the right indicates larger job growth. A bubble’s vertical location on the chart shows the average industry salary.
Remember, these are Seasonally Adjusted Numbers, so they aren’t cumulative!
BLS Average Weekly Wages
| Date | Average Weekly Wage |
| April 2023 | $1,147.58 |
| March 2023 | $1,141.34 |
| February 2023 | $1,141.61 |
| January 2023 | $1,146.14 |
| December 2022 | $1,125.73 |
| November 2022 | $1,129.01 |
| October 2022 | $1,124.01 |
| September 2022 | $1,119.87 |
| August 2022 | $1,116.42 |
| July 2022 | $1,116.54 |
| June 2022 | $1,106.76 |
| May 2022 | $1,105.47 |
| April 2022 | $1,102.01 |
| December 2021 | $1,086.46 |
BLS Employment and Average Weekly Earnings by Industry
April 2023, Seasonally Adjusted Employment
We’ve added another column to the table below showing the employment levels the BLS reported the previous month. Note that due to “seasonal adjusting,” although they may claim that there was a “monthly increase” (or decrease), there isn’t always an actual increase; you can’t just subtract last month’s “employment level” from this month’s level. For instance, Wholesale was supposed to have 6,055,300 employees in March and have a -2,200 “decrease”, but in April, there were 6,043,200 employed. That looks like a -12,100 “decrease” to me. And Professional and Business Services went from 22,952,000 to 22,945,000 for a seasonally adjusted 43,000 increase, but it seems like a -7,000 “decrease” to me.
| Industry | April Monthly Increase | Apr. Ave. Weekly Earnings | April Employment Level | Employment Level March |
| Total Private Employment | 230,000 | $1,147.58 | 133,103 | 133,012,000 |
| Mining and Logging | 7,000 | $1,708.98 | 642,000 | 635,000 |
| Construction | 15,000 | $1,407.79 | 7,903,000 | 7,888,000 |
| Manufacturing | 11,000 | $1,287.20 | 12,991,000 | 12,983,000 |
| Wholesale trade | -2,200 | $1,426.29 | 6,043,200 | 6,055,300 |
| Retail trade | 7,700 | $715.80 | 15,536,300 | 15,526,800 |
| Transportation and Warehousing | 10,600 | $1,094.40 | 6,743,300 | 6,726,500 |
| Utilities | 1,000 | $2,100.18 | 555,300 | 554,000 |
| Information | 1,000 | $1,724.25 | 3,096,000 | 3,093,000 |
| Financial Activities | 23,000 | $1,599.00 | 9,122,000 | 9,098,000 |
| Professional and Business Services | 43,000 | $1,475.34 | 22,945,000 | 22,952,000 |
| Private Education and Health Services | 77,000 | $1,094.52 | 25,139,000 | 25,088,000 |
| Leisure and Hospitality | 31,000 | $533.65 | 16,543,000 | 16,577,000 |
| Other Services | 5,000 | $953.82 | 5,844,000 | 5,835,000 |
Source: BLS
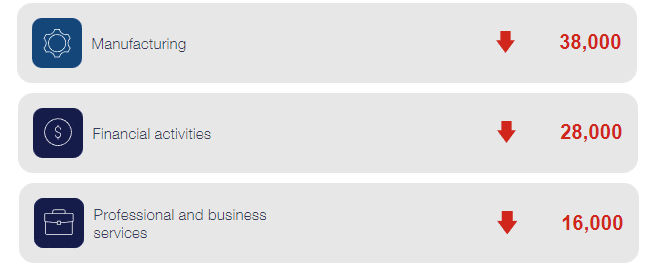
Note: As usual, ADP has an entirely different picture. BLS says only Wholesale lost jobs, while ADP says Manufacturing, Financial, and Professional lost jobs.
ADP Job Losers
April saw three categories lose employees according to ADP, compared to only Wholesale for BLS.
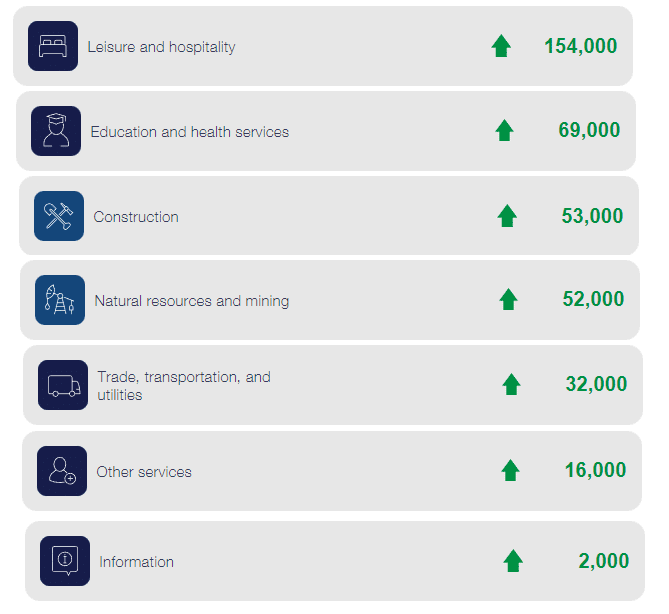
ADP Job Gainers
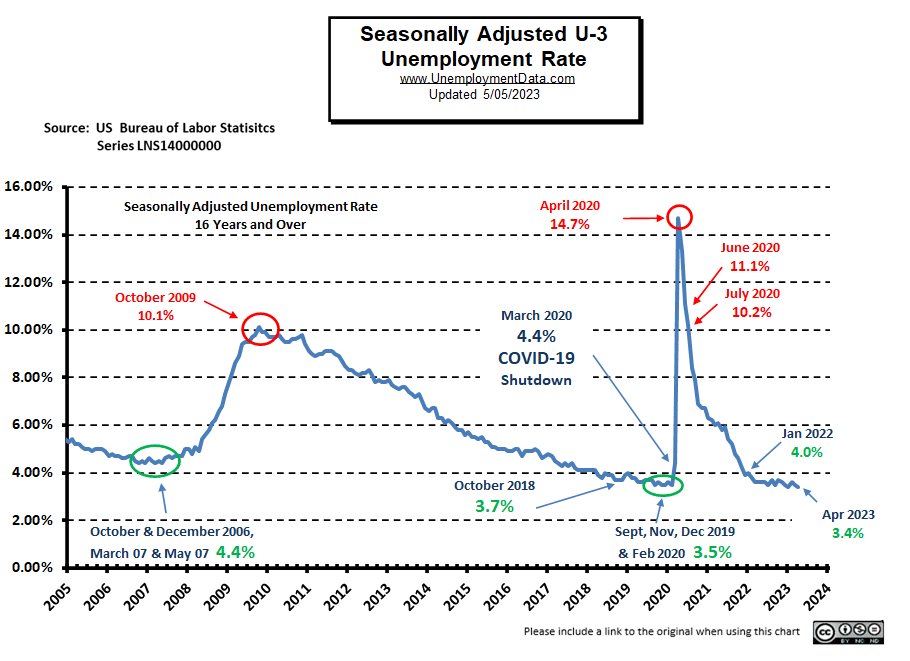
Unemployment
April’s Seasonally Adjusted Unemployment is 3.4%, down from 3.5% in March.
 See the Unemployment Rate Chart for more information.
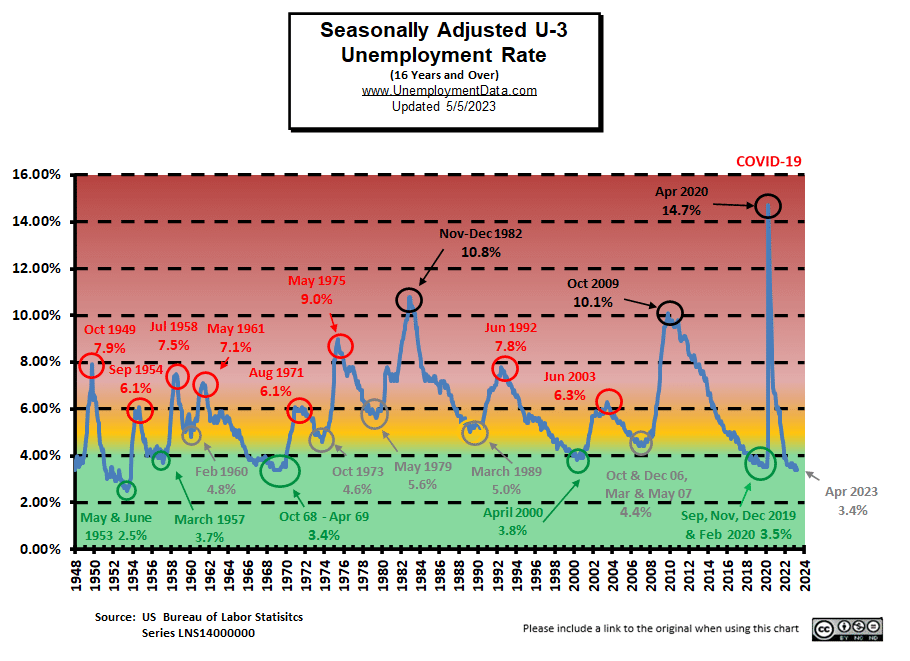
Unemployment Still Historically Low
Unemployment is below several previous lows of 1960, 1973, 1979, 1989, 2006-7, and slightly below the pre-Covid lows of 2019. This means that unemployment is well within the “green zone” in the chart above. Interestingly, this may be a factor in increasing inflation pressures. Perhaps, a bit perversely, market participants have been hoping to see signs of a rising unemployment rate in anticipation that it might signal an end to inflationary pressures and FED tightening. Still, so far, that hasn’t happened.
 Click for a larger Image
April 2023 Labor Force Participation Rate
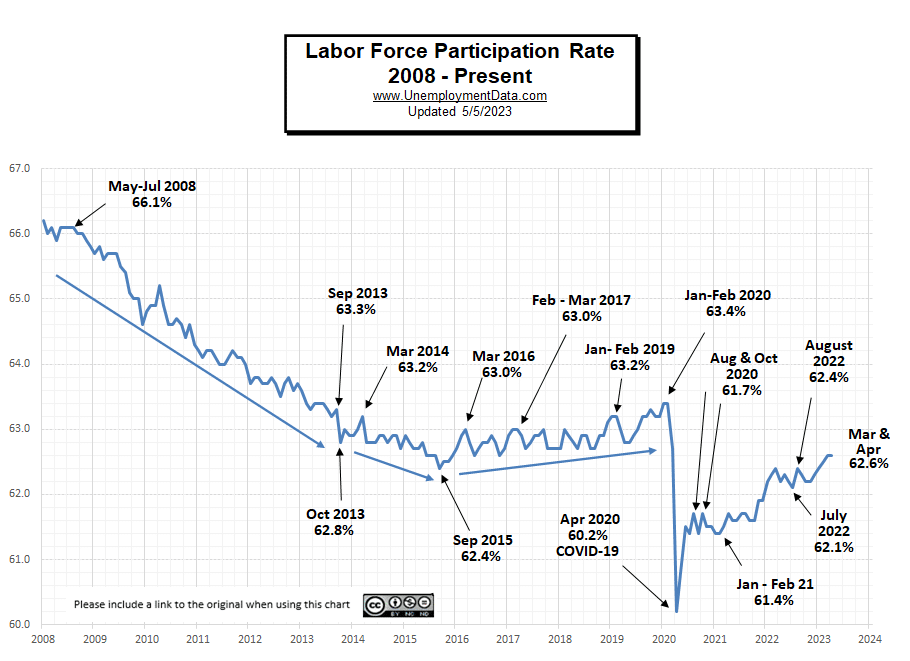 See Labor Force Participation Rate for more information.
Seasonally Adjusted U1 through U6 Unemployment Rates
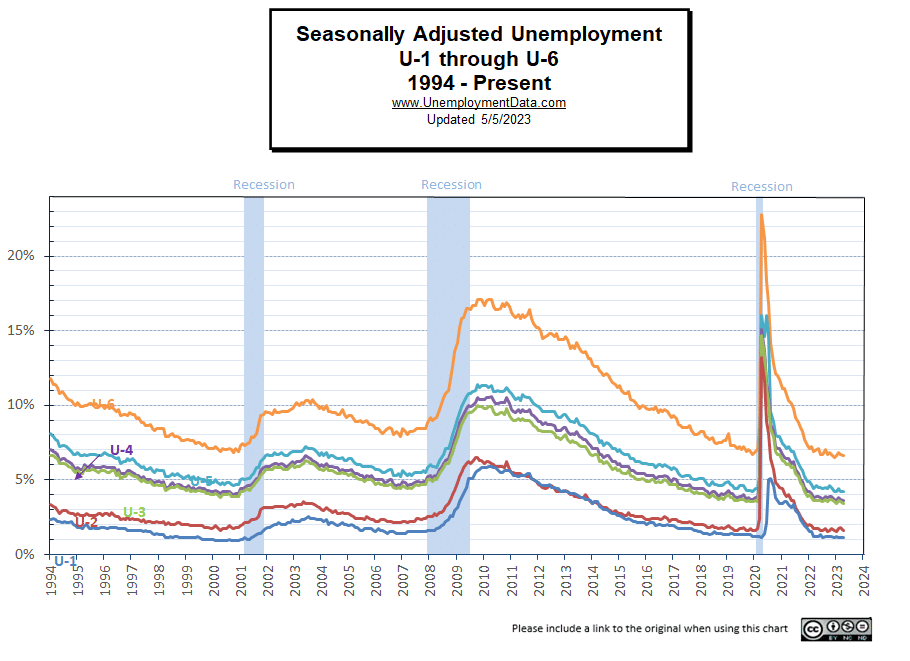 For more information about the various measurements of unemployment, see What Is U-6 Unemployment?
Seasonally Adjusted Unemployment by Education
Last month we saw a decrease in unemployment by the uneducated, but this month it rose again, while all other categories fell.
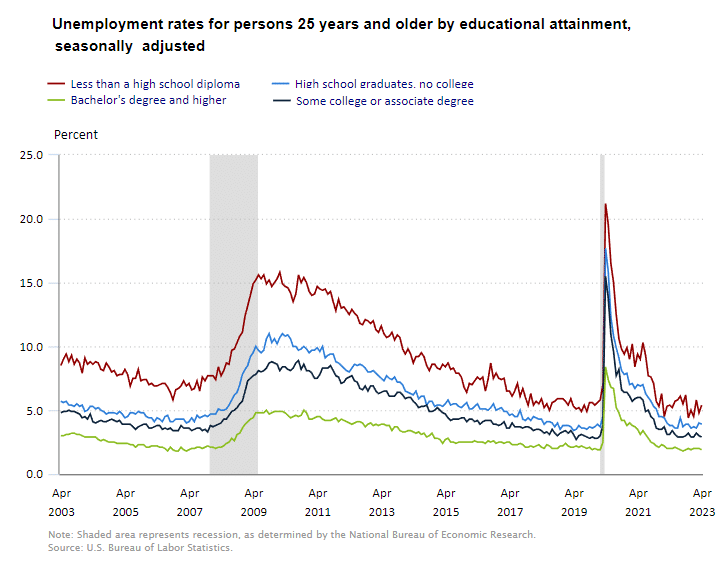 Source: BLS
Employment-Population Ratio
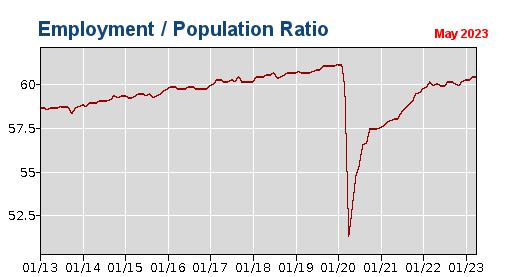 In April, the Employment / Population ratio held steady at 60.4% of the population employed.
See Employment Population Ratio for more information
Read more on UnemploymentData.com.
- Work Injury? Short-Term Income Options While You Mend
- March: Full Employment?
- 5 Must-Know Tips for Optimizing Your Job Search
- Why Becoming a Flooring Installer is a Stable Career Path
- Strategies for Conquering Job Search Frustration
From InflationData.com
- Can the Dollar Retain Its Ultimate Currency Status?”
- What are “Sticky Prices,” and Why Do They Matter?
- Inflation Less Than Experts Predict in March
- The 3 Major Causes of Bank Problems
- Central Banks Respond Differently to the Banking Crisis
From Financial Trend Forecaster
- Moore Inflation Predictor
- NYSE ROC
- NASDAQ ROC
- Commercial Banks Suffer Along With Commercial Real Estate
- Big Move Coming in Stocks
- The Bullish and Bearish Cases in the Market
- Stock Market Outlook – March 24, 2023
- Corporate Bonds: “The Next Shoe to Drop”?
- Silicon Valley Bank, Silvergate, and “The Everything Bust”
- Bull Trap or Market Consolidation?
- 60% stocks, 40% bonds? Ha!
- U.S. Dollar: Has the Mainstream Been Way Too Confident?
From OptioMoney.com
- How Buying a House Affects Your Finances
- Top Personal Finance Apps of 2023
- How to Deal with Financially Irresponsible Family Members
- How to Financially Prepare for a Baby
- 6 Ways to Cope with Bad Financial Decisions
- Simple Ways to Save Money When Shopping Online
From Your Family Finances
- The Financial Benefits of Installing Solar Panels
- Life Insurance or Annuity?
- You Get What You Pay for in Cheese
- What You Need to Know About Home Mortgages
- How to Save Money When Moving Abroad
- 5 Different Approaches to Buying a Car
- 5 Tips for Qualifying for an Investment Property Mortgage
- Financial Preparation for a New Baby