![]() Correction: The differential was only 3.5% in August 2018 and 3.2% in September 2006 so we are only nearing the 2006 level not at the 2006 level.
Correction: The differential was only 3.5% in August 2018 and 3.2% in September 2006 so we are only nearing the 2006 level not at the 2006 level.
The U.S. Bureau of Labor Statistics (BLS) released their monthly employment survey results for the month of August on September 7th .
The current “Seasonally Adjusted” Unemployment Rate for August (released September 7th) is 3.9% unchanged from last month.
Looking back, Seasonally Adjusted U-3 started 2017 at 4.8% then it bounced around between 4.3% and 4.4% from April through October 2017, then it was 4.1% from October 2017 through March 2018. It was 3.9% in April, 3.8% in May, 4.0% in June, and 3.9% in July.
Typically Unemployment levels are worse in June and July so seasonally adjusting takes that into consideration.
|
Unadjusted |
Unadjusted U-3 |
|
| 2017 | 2018 | |
| May | 4.1% | 3.6% |
| June | 4.5% | 4.2% |
| July | 4.6% | 4.1% |
| August | 4.5% | 3.9% |
Key August Employment and Unemployment Numbers
- Adjusted U-3 Unemployment- 3.9% unchanged from July, down from 4.0% in June but above the 3.8% in May, it was 3.9% in April but still Below the 4.1% October 2017 – March 2018.
- Unadjusted U-3 Unemployment- 3.9% down from 4.1% in July and 4.2% in June but still above the 3.6% in May, and 3.7% in April below the 4.1% in March.
- Unadjusted U-6 Unemployment- 7.4% down from 7.9% in July, 8.1% in June, up slightly from record lows of 7.3% in May, and 7.4% in April. Below the 8.1% in March and 8.6% in February.
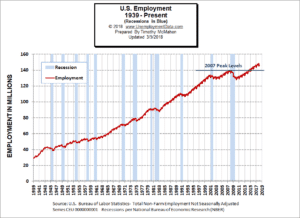
- Employment 149.226 million up from 148.901 million in July.
- August Labor Force Participation Rate 62.7% down from July LFPR 62.9%
See Current Unemployment Chart for more info.
Full Employment is Near – Differential between U3 and U6 reaches September 2006 Lows
In August we saw a massive drop in the differential between U-3 and U-6 so perhaps we are getting closer to “full employment” the lows on this chart are at 2.7% in October 2000 and 3.2% in September 2006. Since the current differential is once again 3.2% we have reached the lows of 2006. Back in January 2017 the media was saying that we were at “Full Employment” and we couldn’t expect anything better, manufacturing jobs would never come back etc. At that time I said we had a long way to go and that the differential between the U-6 and U-3 was nowhere near bottoming (the sign of full employment) at the time the differential was around 5%. See: Is the U.S. Really at “Full Employment”? But with the differential currently at 3.2% now we are at or very near that level. Since October 2000 reached a low of 2.7% we could still go a bit lower.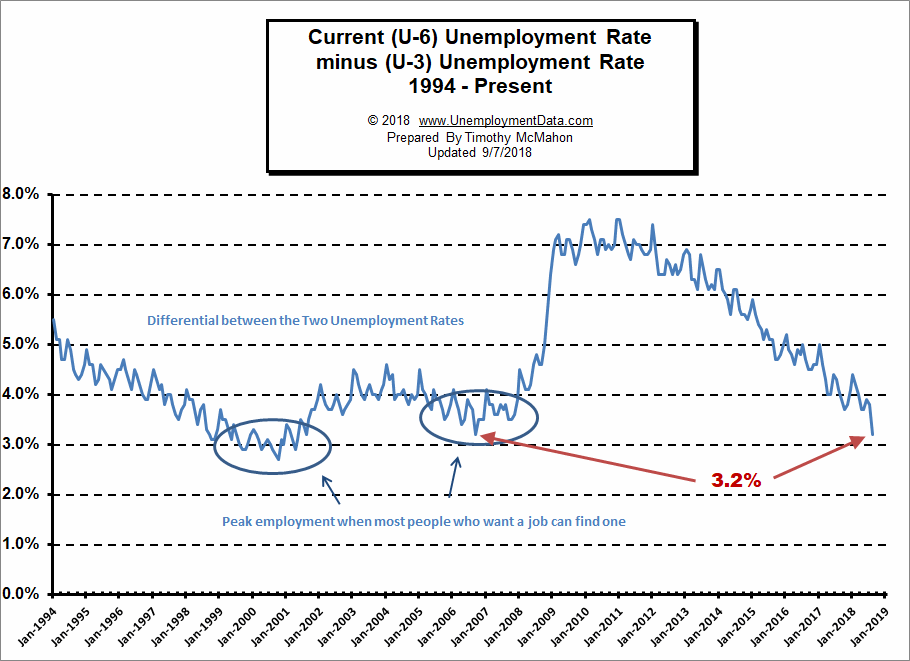
See Current U-6 Unemployment Rate for more info.
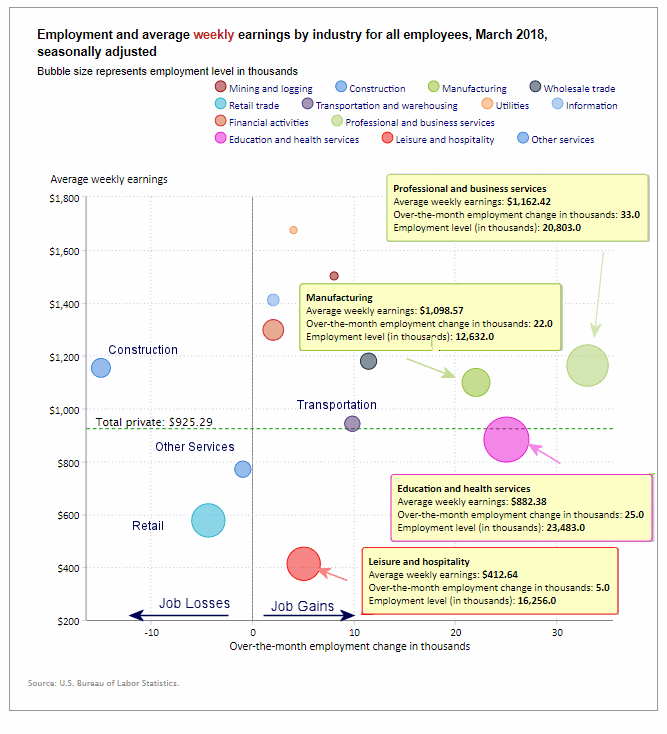
Employment by Sector
The employment “bubble chart” gives us a good representation of how each sector of the economy is doing (employment wise). As we can see from the chart below [Read more…] about Full Employment is Near – Differential between U3 and U6 reaches September 2006 Lows
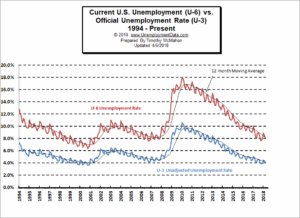 Looking at the broader measure of Unemployment which includes discouraged workers, we see that the U-6 unemployment rate fell from 8.9% in