
![]()
Employment Up – Unemployment Down
- Unadjusted Employment rose from 152.642 million to 153.073
- Labor Force Participation is Down from 62.4% to 62.3%
- Adjusted U-3 was Down from 3.7% to 3.5%
- Unadjusted U-3 was Down from 3.8% to 3.3%
- Unadjusted U-6 was Down from 7.0% to 6.4%
The U.S. Bureau of Labor Statistics (BLS) released its employment / unemployment report for September on October 7th.
According to the Commissioner of the U.S. Bureau of Labor Statistics:
“Total nonfarm payroll employment increased by 263,000 in September, and the unemployment rate edged down to 3.5 percent, the U.S. Bureau of Labor Statistics reported today. Notable job gains occurred in leisure and hospitality and in health care.”
You can read the full BLS report here.
As usual, they are talking about “Seasonally Adjusted Jobs” from the “Household Survey” rather than looking at the results reported by actual companies in the BLS “Establishment Survey”.
Looking at the Establishment Survey report, we see…
Originally the BLS reported employment of 152.572 million for August, which they adjusted up to 152.642 million. So, 70,000 additional jobs appeared for August.
September gained an additional 431,000 jobs bringing the total up to 153.073 million.
Normally this would be good news, but perversely the market was hoping for a bad report which would indicate that the FED could cut back on its tightening.
A good September 2022 Unemployment report means inflation is not yet under control, so the FED will continue aggressively tightening.
According to Bloomberg:
“The US labor market stayed strong in September as the unemployment rate unexpectedly returned to an historic low, leaving the inflation-phobic Federal Reserve on course to deliver yet another aggressive interest-rate hike.”
In response, the NYSE lost just over 2% of its value on Friday after the release of the report.
However, just 4 days earlier, on Monday, the BLS had released its “Job Openings and Labor Turnover Survey” for August, which in the minds of schizophrenic market analysts, appeared to indicate that the Labor market might possibly be softening just a little, and the market used that as an excuse to rally. So the NYSE opened the week at 13,472… rallied to 14,340… then fell back to 13,798 for the week. (Actually, a 2.4% net gain for the week).
NOTE: The reason we look at the NYSE rather than the more commonly quoted DOW is breadth. The NYSE covers the vast majority of U.S. stocks rather than just a few major ones covered by the DOW.
ADP® National Employment Report
According to ADP In collaboration with Stanford Digital Economy Lab
- Businesses created 208,000 jobs in September, up from a revised 185,000 in August, as schools reopened and pandemic concerns receded. But while job growth is stable, it remains below the recent three-month average.
In other words, jobs are still growing but not as fast as they have been. Despite this slowing of job growth and the FED tightening, ADP’s Chief Economist Nela Richardson believes jobs will continue to grow.
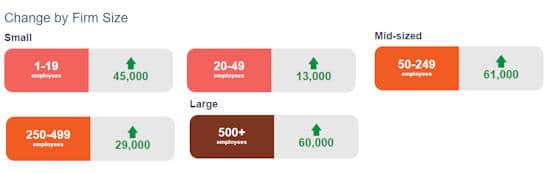
ADP also lists increases by “firm size”.
At some point, it may look like small-size firms (i.e. 1-19 employees) are increasing, while everything else is decreasing, but that could simply be the result of people starting companies because they can’t find any other jobs (although this isn’t currently the case). Currently, there are increases across the board.
Establishment Survey Employment
Looking at the chart for employment, we see that current employment (153.073 million) is just a hair under the 2019 peak (153.095 million) although the civilian population is almost 5 million higher now. So despite all the talk of the strong employment situation, there is a slight disconnect.
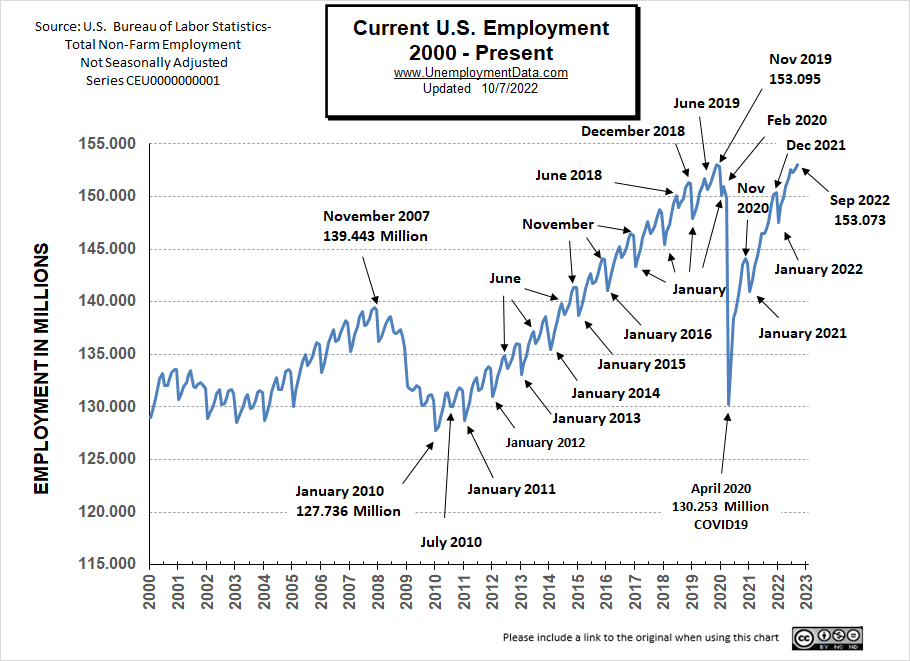
See Current Employment for more info.
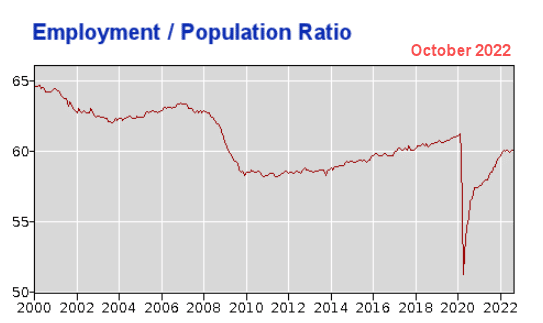
That disconnect comes from the Employment / Population ratio, i.e., the percentage of the population that is in the workforce. Since the unemployment rate only measures the percentage of the population that is in the workforce, the unemployment rate in 2019 can be the same as the current unemployment rate even though there are 5 million more people.
In the following chart, we can see that the Employment / Population ratio peaked in early 2020, and although the percentage of the population reentering the workforce has increased, it is still not back to previous levels. And nowhere near 2000 levels.
Interestingly, the “pandemic” is still an excuse for many people. According to the Household Survey Supplemental Data:
June: “Among those not in the labor force in June [2022], 610,000 persons were prevented from looking for work due to the pandemic …
July: “Among those not in the labor force in July, 548,000 people were prevented from looking for work due to the pandemic.”
August: “Among those not in the labor force in August, 523,000 people were prevented from looking for work due to the pandemic…”
September: “In September, 1.4 million persons reported they had been unable to work because their employer closed or lost business due to the pandemic–that is, they did not work at all or worked fewer hours at some point in the 4 weeks preceding the survey due to the pandemic. This measure is down from 1.9 million in the previous month and from 49.8 million in May 2020. Among those who reported in September that they were unable to work because of pandemic-related closures or lost business, 21.4 percent received at least some pay from their employer for the hours not worked, essentially the same as in August. Among those not in the labor force in September, 452,000 persons were prevented from looking for work due to the pandemic, little changed from the prior month. In May 2020, 9.7 million persons were prevented from looking for work due to the pandemic. (To be counted as unemployed, by definition, individuals must be either actively looking for work or on temporary layoff.)”
September 2022 Employment by Sector
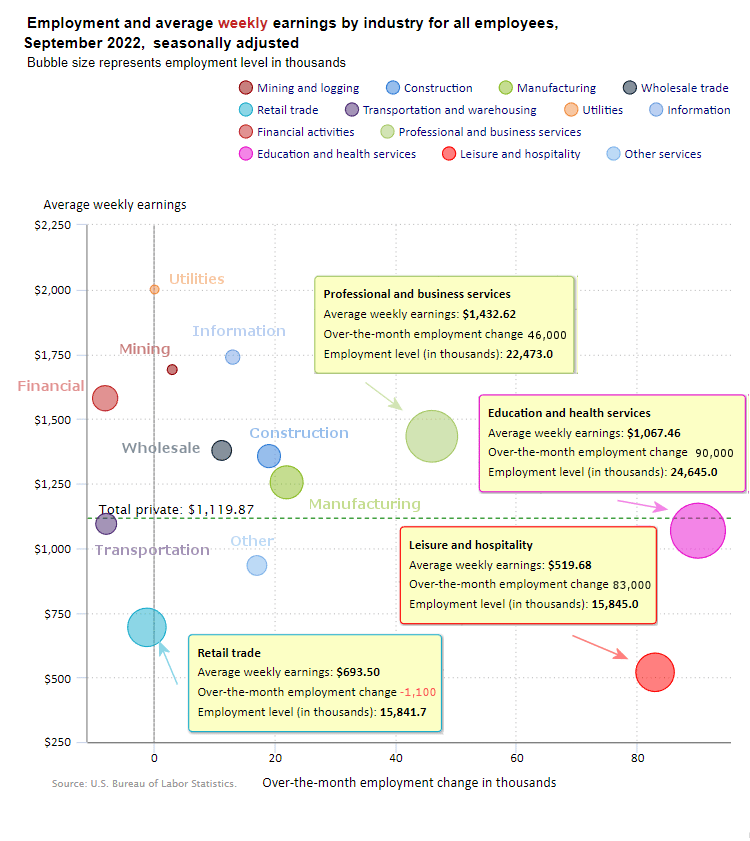
The employment “bubble chart” is a quick and easy way to see how each sector performs on a seasonally adjusted basis. The Bubble’s Size tells us the total Employment for that industry (i.e., larger bubbles mean more people are employed in that sector).
The bubble’s location on the chart tells us that there has been a change in Employment Levels over the most recent month… A bubble further to the right indicates larger job growth. A bubble’s vertical location on the chart shows the average industry salary.
One sign of possible impending weakness is that we have three sectors that actually lost jobs in September (unlike previous months where all sectors gained jobs). In September, the Financial, Retail, and Transportation sectors lost jobs, and as usual, the Utility sector was virtually unchanged.
Average Weekly Wages Rose
$1,119.87 in September, $1116.42 in August, $1,116.54 in July, $1,106.76, in June, $1,105.47 in May and $1,102.01 in April, and $1,086.46 in December 2021.
 Click for a larger image.
Remember, these are Seasonally Adjusted Numbers, so they aren’t cumulative! Education and Health Services was the largest gainer (again) with 90,000 new jobs, Leisure and Hospitality was the second-largest gainer with 83,000 new jobs, and Professional and Business Services gained 46,000 jobs.
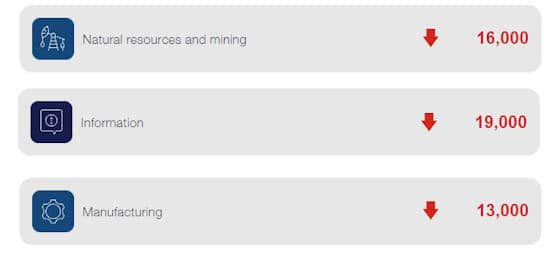
Note: Although the BLS says the Information, Mining, and Manufacturing, sectors increased, ADP says they actually decreased.
ADP Change by Sector
Employment and Average Weekly Earnings by Industry
September 2022, Seasonally Adjusted Employment
We’ve added another column to the table below that shows the employment levels that the BLS reported the previous month. Note that although they may claim that there was a “monthly increase”, there isn’t always a real increase, you can’t just subtract last month’s “employment level” from this month’s level. This is due to “seasonal adjusting”. We’ve marked strange instances with an asterisk *.
| Industry | Monthly Increase | Average Weekly Earnings | Employment Level September | Employment Level August |
| Total Private Employment | 288,000 | $1,119.87 | 130,736,000 | 130,510,000 |
| Mining and Logging | 3,000 | $1,690.46 | 633,000 | 641,000 |
| Construction | 19,000 | $1,356.05 | 7,719,000 | 7,708,000 |
| Manufacturing | 22,000 | $1,254.54 | 12,880,000 | 12,852,000 |
| Wholesale trade | 11,300 | $1,377.84 | 5,909,200 | 5,896,200 |
| Retail trade | -1,100 | $693.50 | 15,841,700* | 15,857,000 |
| Transportation and Warehousing | -7,900 | $1,093.79 | 6,528,700 | 6,543,000 |
| Utilities | 200 | $2,000.55 | 541,900 | 541,600 |
| Information | 13,000 | $1,738.87 | 3,043,000 | 3,032,000 |
| Financial Activities | -8,000 | $1,579.78 | 8,957,000* | 8,981,000 |
| Professional and Business Services | 46,000 | $1,432.62 | 22,473,000 | 22,441,000 |
| Education and Health Services | 90,000 | $1,067.46 | 24,645,000 | 24,544,000 |
| Leisure and Hospitality | 83,000 | $519.68 | 15,845,000 | 15,768,000 |
| Other Services | 17,000 | $932.80 | 5,719,000 | 5,705,000 |
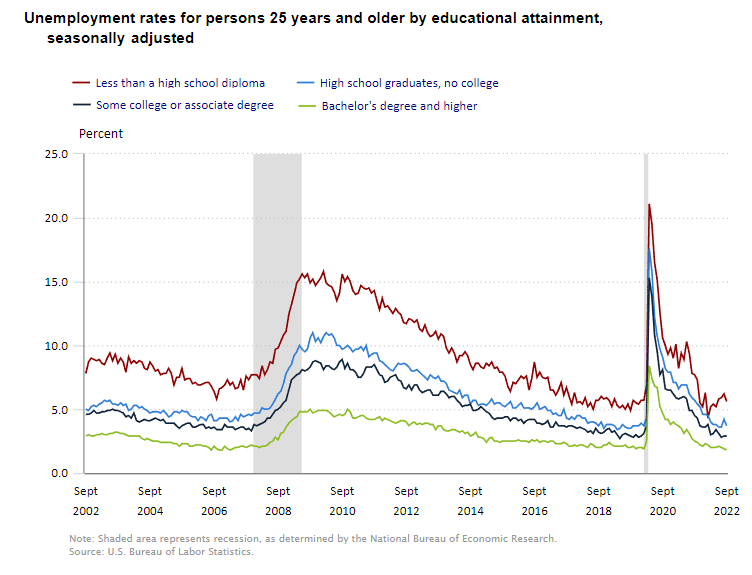
September 2022 Unemployment by Education
After several months of increases, unemployment among the uneducated has fallen, seemingly indicating a tighter job market. Counterintuitively, unemployment among those with some college actually rose slightly.
 Source: BLS
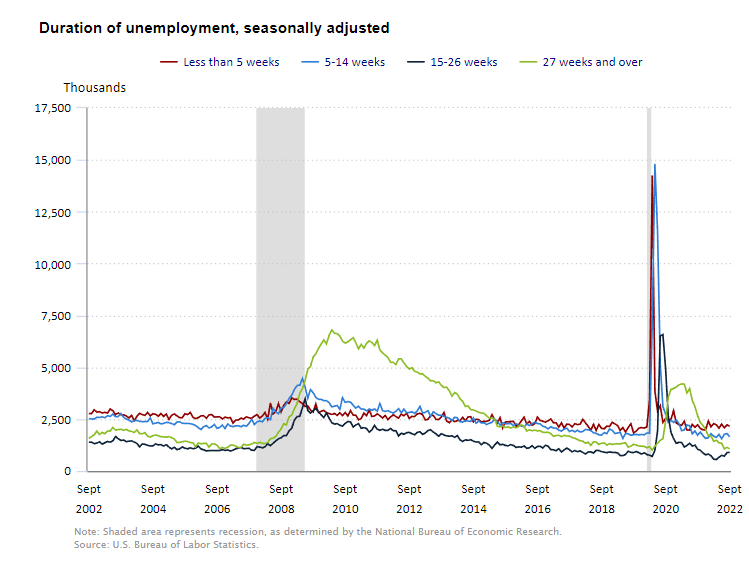
Duration of Unemployment
Unemployment among those jobless for 15-26 weeks is rising, indicating that it is becoming more difficult to find a job. But it hasn’t spilled over to the 27-week category yet.
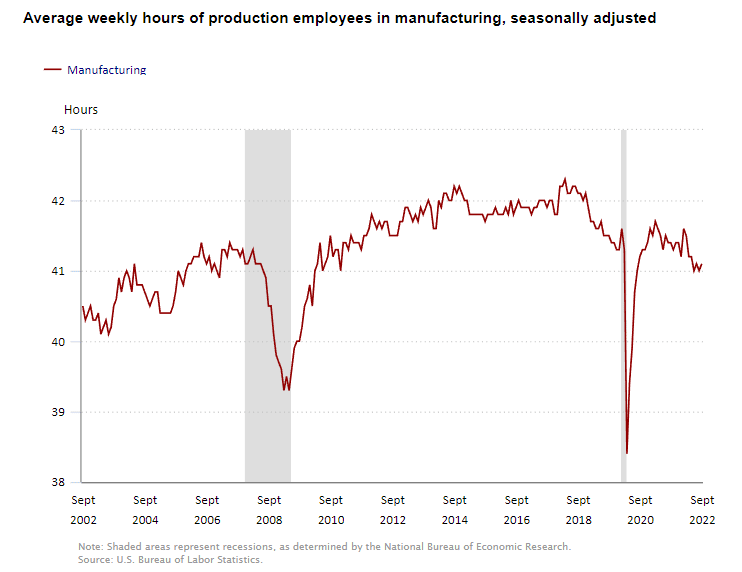
 Average Weekly Hours
In a tight labor market, we would expect each worker to be working more hours. But that is not what was happening from March through June. But now, average weekly hours have leveled off and even risen slightly this month.
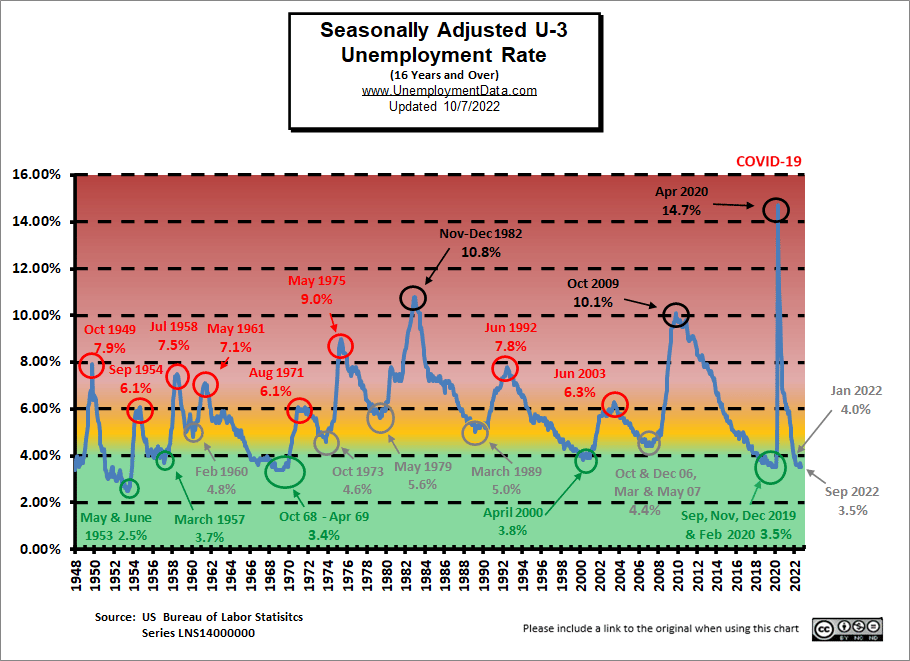
Unemployment Still Historically Low
Unemployment levels are in the historically low territory. After all, the FED did pump unprecedented TRILLIONS into the economy to get us to this place.
See: FED Actions for more info.
But we can see that Seasonally Adjusted U-3 is definitely in the “Green” territory.
 Click for a larger Image
September 2022 Labor Force Participation Rate
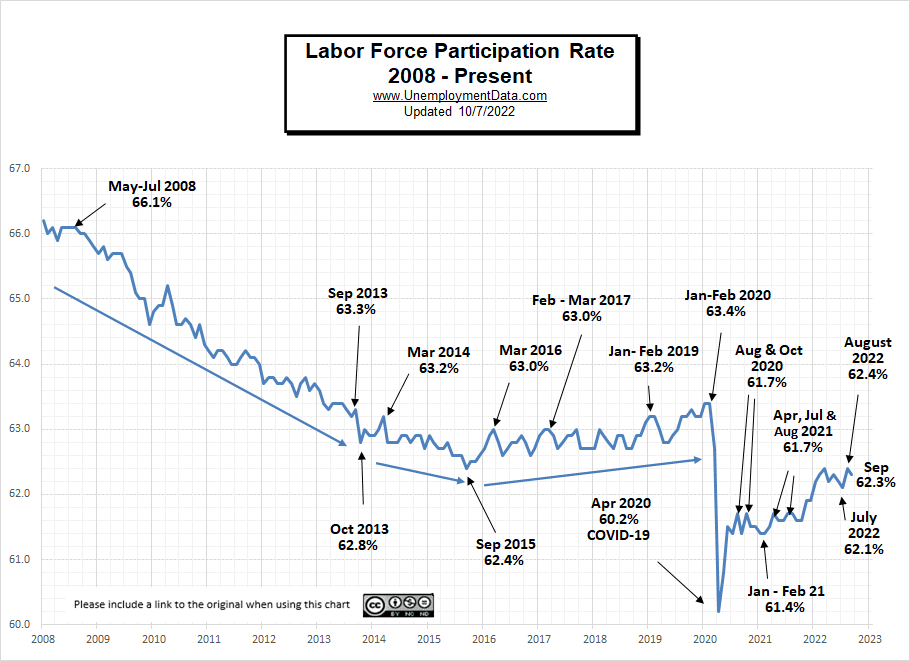 LFPR ticked down 1/10th% in September from 62.4% in August to 62.3% in September.
See Labor Force Participation Rate for more information.
Seasonally Adjusted U1 through U6 Unemployment Rates
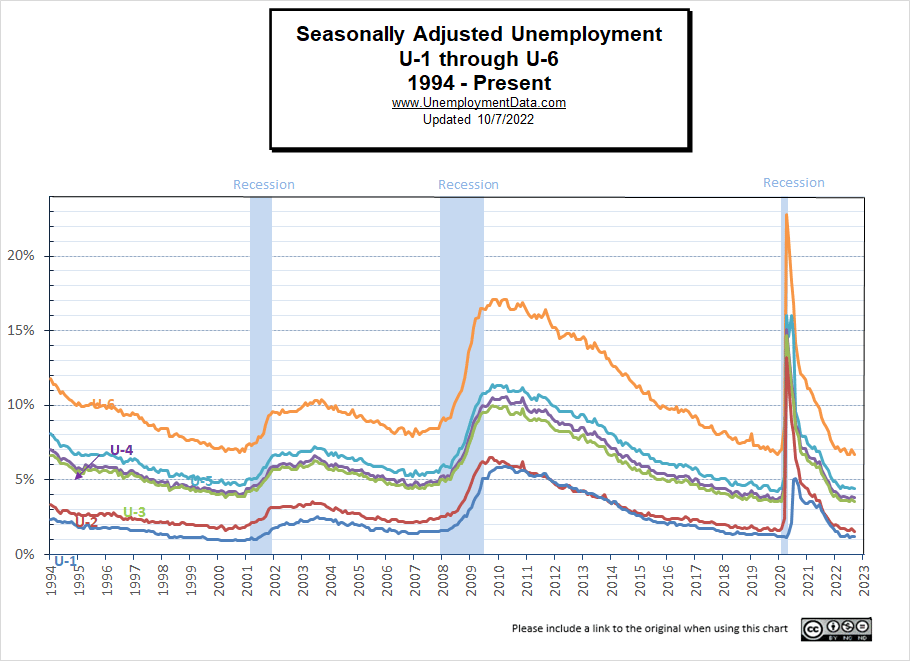
For more information about the various measurements of unemployment, see What Is U-6 Unemployment?
Read more on UnemploymentData.com.
- Injured on the Job? 3 Things to Immediately Do
- 5 Signs It’s Time to Make a Career Change
- Building Confidence to Help You Reenter the World
- August: Employment and Labor Force Participation Up
- 6 Steps to Start Your Home-Based Business
From InflationData.com
- Jerome Powell “Channels” His Inner Paul Volcker
- August 2022 is Actually Disinflationary
- Everything They Tell You About Inflation is Wrong
- Will Corn Prices Drive Up Inflation?
- Two Ways to Destroy the Economy: Hyperinflation and Central Planning
- Gas Prices Fall, Bringing Down July 2022 Inflation
- Total U.S. Cumulative Inflation
- Have Commodity Prices Peaked? Does That mean Recession?
From Financial Trend Forecaster
- Moore Inflation Predictor
- NYSE ROC
- NASDAQ ROC
- Are Housing Prices Set to Crash?
- Half-Way to the Stock Market’s Worst Case Scenario
- Don’t Fight the FED
- Non-Fungible Tokens (NFTs): Another Financial “Fumble”
- Will Loan Forgiveness Raise College Costs?
- Will Another “Great Depression” Start in Europe?
- Stocks Don’t Go Straight Up (or Straight Down)
- What the “Housing Busts” Indicator Is Saying Now
- How to Prepare for a Hard-Hitting Bear Market (Think 1929-1932)
- The Dow 8 Waves are Incomplete
From OptioMoney.com
- Warning Signs You’re On the Road to Financial Catastrophe
- Money Habits That Can Help You Retire Early
- 7 Ways to Save Money When Living in a Big City
- How Addiction Can Cause Financial Trouble
- Common Mistakes to Avoid When Investing in Real Estate
From Your Family Finances