
March 2022 Unemployment Report Doesn’t Beat Expert’s Predictions
![]()
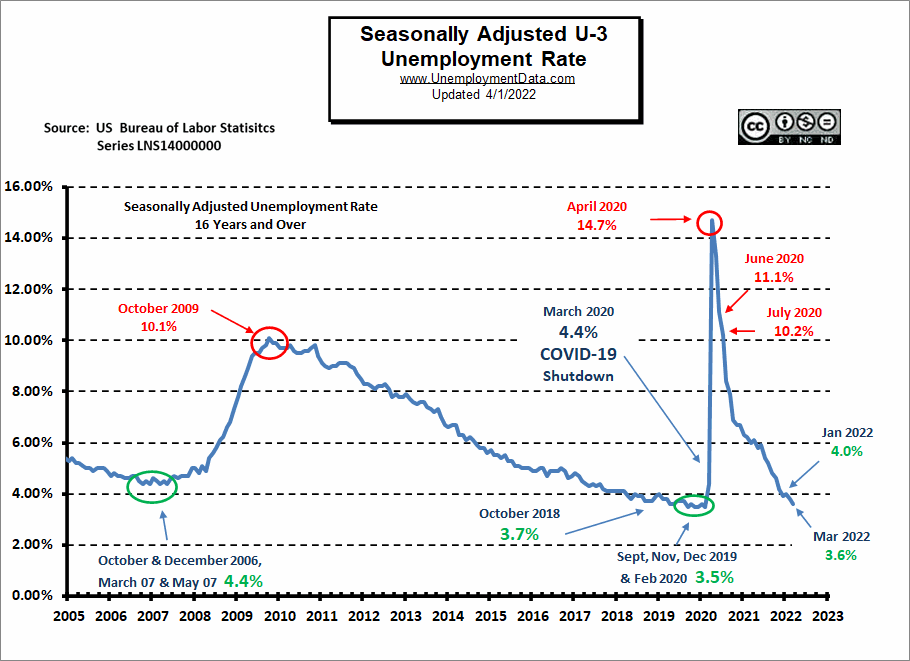
- Adjusted U-3 was Down from 3.8% to 3.6%
- Unadjusted U-3 was Down from 4.1% to 3.8%
- Unadjusted U-6 was Down from 7.6% to 7.1%
- Labor Force Participation Up from 62.3% to 62.4%
- Unadjusted Employment rose from 149.144 million to 149. 938 million
March 2022 Unemployment report:
Although MSNBC is touting it as a win, they admit that experts predicted 490,000 new jobs, but according to the BLS, we only got 431,000, so they could have just as easily spun this as a negative report. Instead, MSNBC gushes about the “new jobs” but then goes on to say, “the U.S. economy has now gained back roughly 93 percent of its pandemic job losses”.
As we’ve consistently pointed out, we are still below peak pre-covid employment levels. Although MSNBC says, “So far in 2022, the economy has created 1.69 million jobs”… we’re still below December 2021 levels… hmm I guess it depends on how you look at it. Unlike what you’d expect from a pandemic… since Covid started the U.S. population is up by 3.8 million, so we need to have more jobs just to be equal. In other words, population inflation does to jobs what monetary inflation does to the cost of living.
According to the Commissioner of the U.S. Bureau of Labor Statistics:
“Nonfarm payroll employment rose by 431,000 in March, and the unemployment rate declined by 0.2 percentage points to 3.6 percent. Notable job gains continued in leisure and hospitality, professional and business services, retail trade, and manufacturing.
Job growth averaged 562,000 per month in the first quarter of 2022, the same as the average monthly gain for 2021. However, Employment is down by 1.6 million, or 1.0 percent, from its February 2020 level before the coronavirus (COVID-19) pandemic.”
As usual, they are talking about “Seasonally Adjusted Jobs” from the “Current Population Survey (CPS)” rather than looking at the results reported by actual companies in the BLS “Current Employment Statistics survey (CES)”.
But looking at the CES report, we see…
Initially, the BLS reported Employment of 148.964 million for February, which they adjusted to 149.144 million. So 18,000 jobs appeared for February. They are saying 149.938 million jobs for March, which is an increase of 974,000 jobs based on their original estimates or an increase of 794,000 based on their updated numbers.
ADP National Employment Report
In addition to the BLS, we can look at the Jobs Report generated by private companies like ADP Research Institute. In this case, ADP numbers are slightly better than BLS “Current Population Survey (CPS)” numbers but worse than their “Current Employment Statistics survey (CES)” numbers.
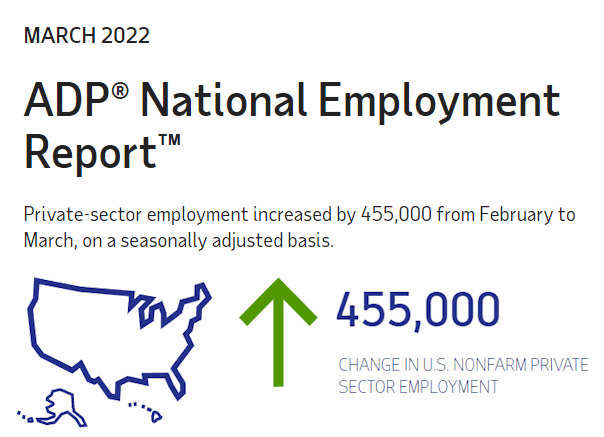
The interesting thing about ADP data is that they also provide breakdowns based on company size. Small businesses with 1-49 employees gained back 90,000 of the -96,000 jobs they lost last month, midsized companies with 50-499 Employees gained 188,000 on top of last month’s 18,000 jobs, and large companies with 500 or more employees gained 177,000 jobs on top of last month’s 552,000 jobs. So the big winners are still large companies.
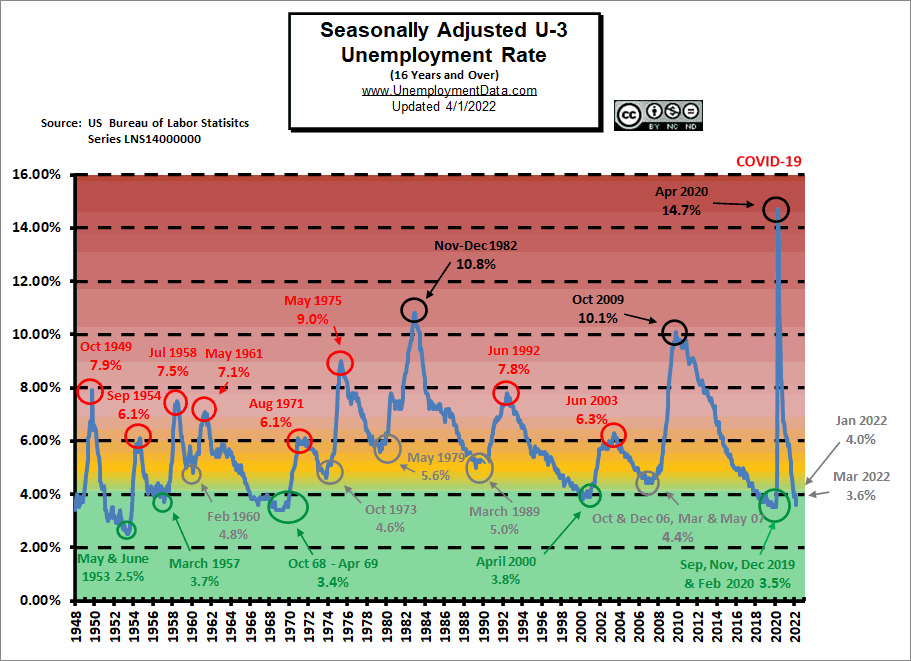
Unemployment Historically Low
In signs of the overheated economy that Larry Summers talked about, companies are finding it increasingly difficult to find qualified workers, and unemployment is nearing historic lows.
 Click for a larger Image
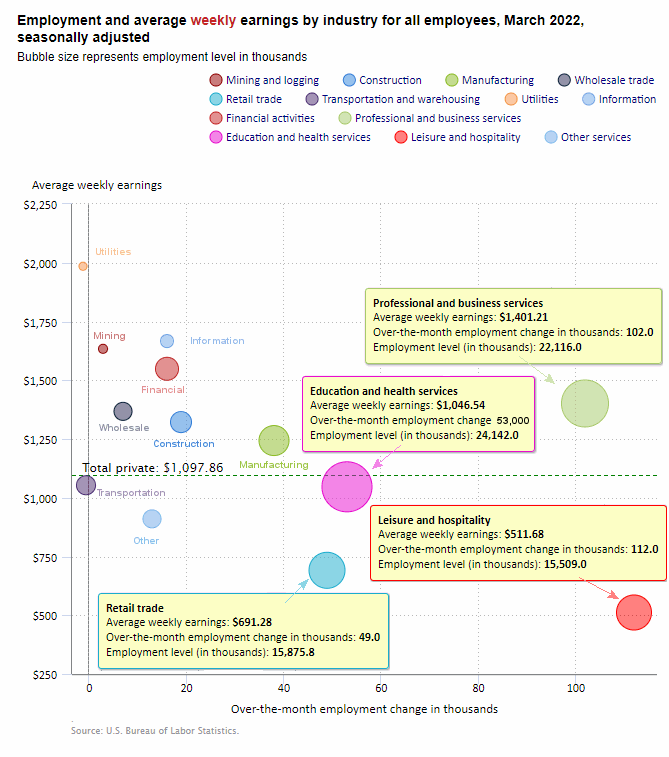
March 2022 Employment by Sector
The employment “bubble chart” is a quick and easy way to see how each sector performs on a seasonally adjusted basis. The Bubble’s Size tells us the total Employment for that industry (i.e., larger bubbles mean more people are employed in that sector).
The bubble’s location on the chart tells us that there has been a change in Employment Levels over the most recent month… A bubble further to the right indicates larger job growth. A bubble’s vertical location on the chart shows average industry salary.
Average weekly wages $1,097.86 up from $1,086.46 in December 2021 and $1,095.83 in February.
 Click for a larger Image.
Remember, these are Seasonally Adjusted Numbers! Once again, Leisure and Hospitality was the largest gainer with 112,000 new jobs. Professional and Business Services gained 102,000 jobs. Education and Health gained 53,000 jobs, and Retail gained 49,000 jobs, while Transportation and Utilities actually lost a few jobs.
Employment and Average Weekly Earnings by Industry
March 2022, Seasonally Adjusted Employment
| Industry | Monthly Increase | Average Weekly Earnings | Employment Level |
| Total Private Employment | 426,000 | $1,097.86 | 128,756,000 |
| Mining and Logging | 3,000 | $1,633.78 | 600,000 |
| Construction | 19,000 | $1,321.92 | 7,628,000 |
| Manufacturing | 38,000 | $1,243.39 | 12,657,000 |
| Wholesale trade | 7,000 | $1,367.57 | 5,788,900 |
| Retail trade | 49,000 | $691.28 | 15,875,800 |
| Transportation and Warehousing | -500 | $1,053.24 | 6,402,300 |
| Utilities | -1,200 | $1,985.18 | 537,100 |
| Information | 16,000 | $1,666.77 | 2,923,000 |
| Financial Activities | 35,000 | $1,516.03 | 8,911,000 |
| Professional and Business Services | 102,000 | $1,401.21 | 22,116,000 |
| Education and Health Services | 53,000 | $1,046.54 | 24,142,000 |
| Leisure and Hospitality | 112,000 | $511.68 | 15,509,000 |
| Other Services | 13,000 | $910.21 | 5,660,000 |
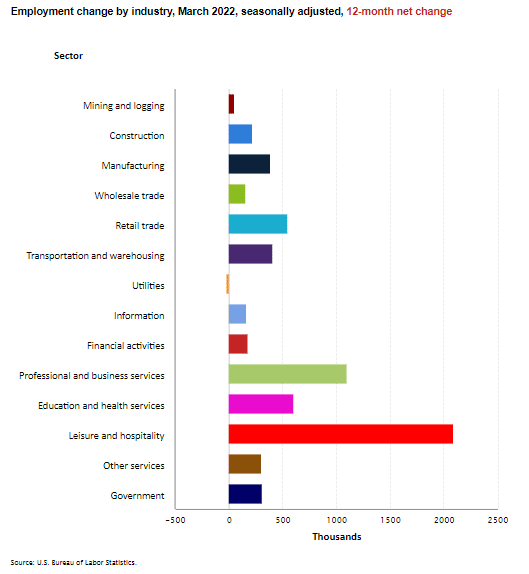
Annual Employment Change by Industry
Looking at Employment Change by Industry over the last 12 months, we can see that Government gained 310,000 jobs over the year while Leisure and Hospitality gained 2,086,000.
March 2022 Unemployment by Education
College grads only have a 2% unemployment rate, while those with less than a High School diploma actually ticked up to 5.2% this month.
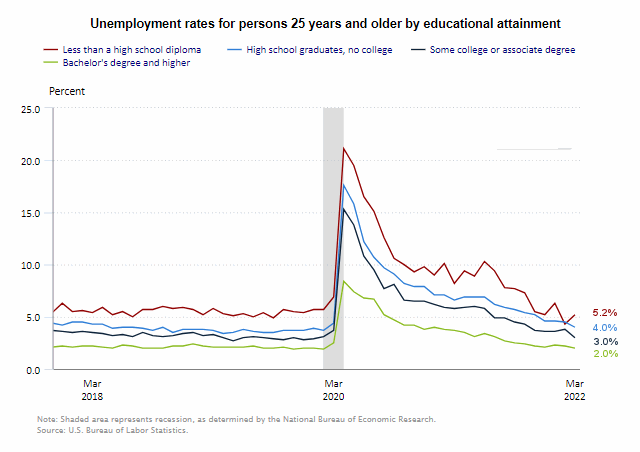
Source: BLS
March 2022 Labor Force Participation Rate
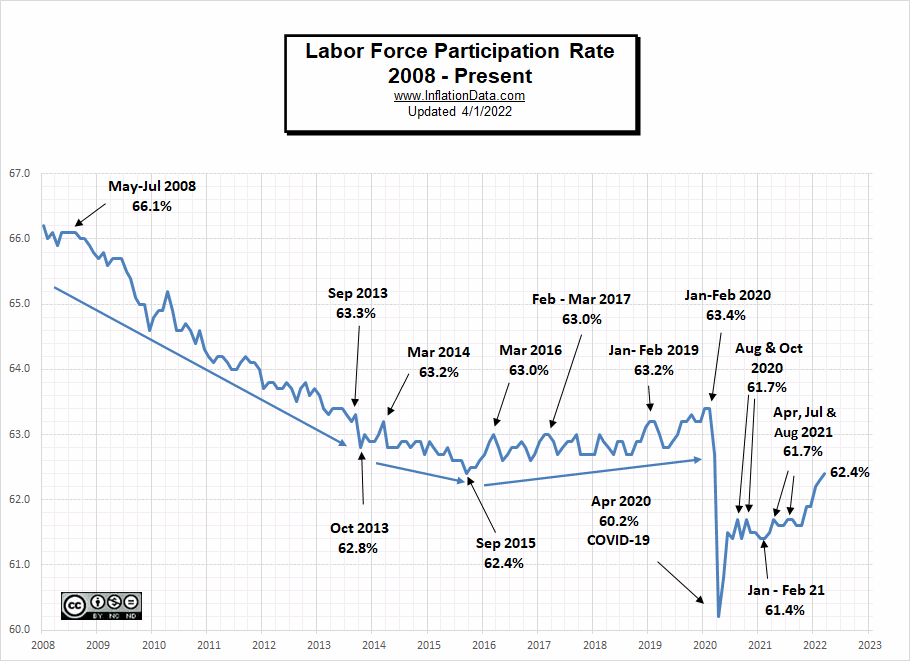 LFPR is up 1/10th% but is still an entire percentage point below Jan-Feb 2020 levels.
See Labor Force Participation Rate for more information.
Seasonally Adjusted U1 through U6 Unemployment Rates
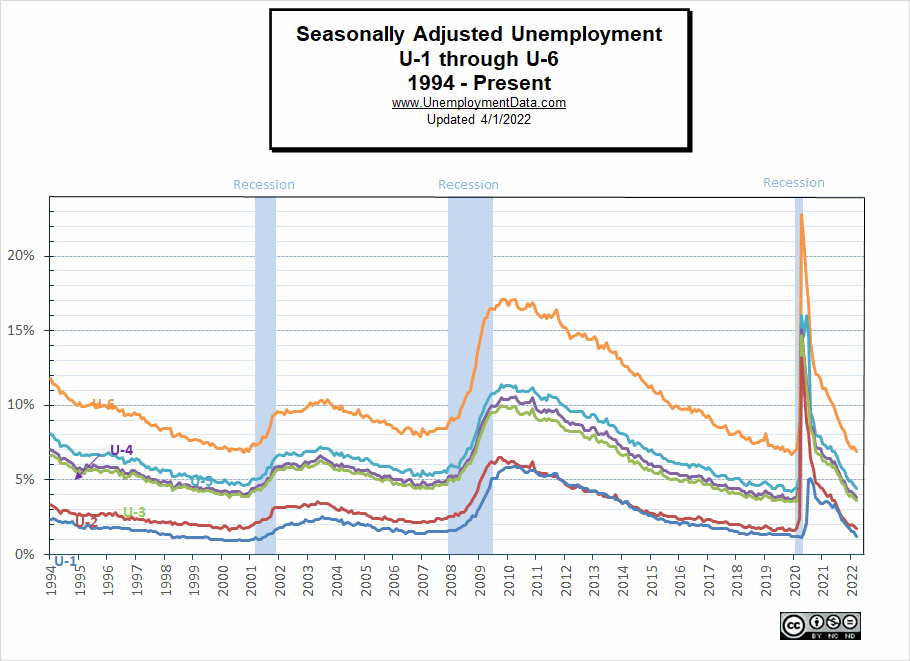
For more information about the various measurements of unemployment, see What Is U-6 Unemployment?
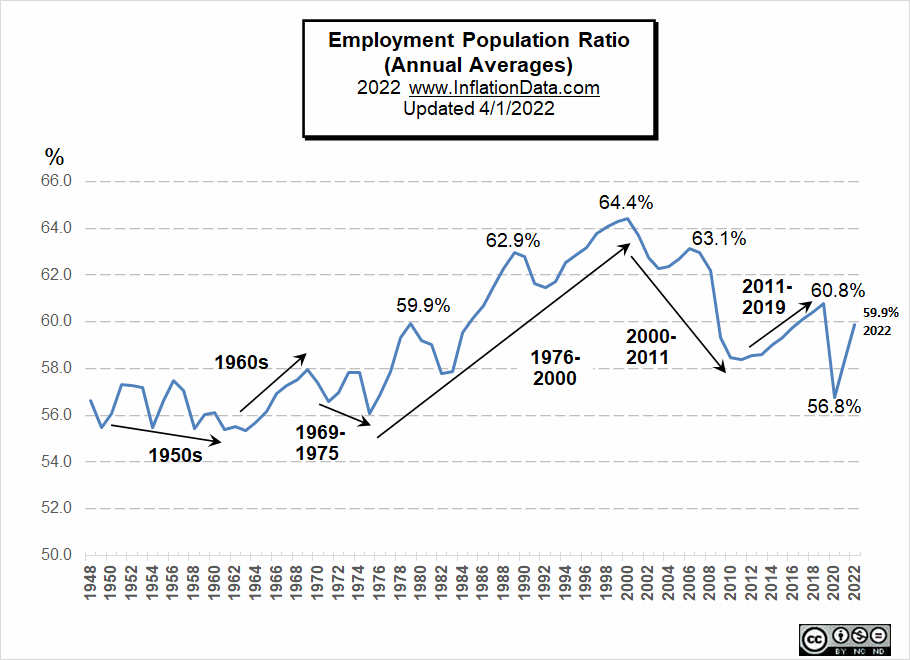
March Employment-Population Ratio
This chart shows the actual percentage of the population that’s working, unlike the Labor Force Participation Rate, which shows the portion of the people working or looking for work. The Annual Average Employment-Population Ratio for 2021 was 58.3%.
By looking at annual averages rather than monthly numbers, we can see the long-term trends in the percentage of the population that is working. For more information and the full commentary on these trends, see Employment-Population Ratio.
Current March 2022 Employment
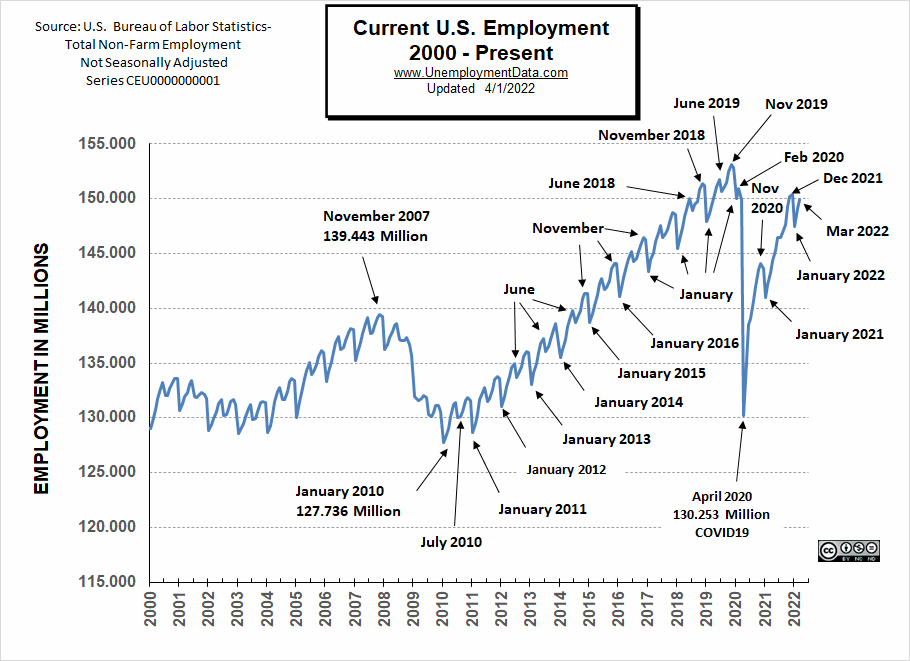
March 2022 employment increased but is still below December 2021 and November 2019 levels, plus the Civilian Non-Institutional Population has increased by 3.8 million since then.
Unemployment is nearing previous cyclical lows. It is currently below the 2006-7 lows of 4.4% and approaching the 2000 low of 3.8% but still not quite to the 2019 low of 3.5%. Current levels are within the “Green Zone” see the chart below for more info.
But there is a significant anomaly at play. If we compare current employment levels to those before COVID (Feb 2020), we see that the Unadjusted U-3 is precisely the same as in February 2020. But there are a little over a million fewer people employed, and the Civilian Population is almost 3.7 million higher.
| February 2020 | March 2022 | Difference | |
| Unadjusted U-3 | 3.8% | 3.8% | 0% |
| Employed | 150.968 million | 149.938 million | -1.03 million |
| Civilian Population | 259.628 million | 263.444 million | 3.8 million |
So the question arises, How can the number of employed be less, even though the population is more, but the unemployment rate is the same? The answer is the Labor Force Participation Rate (LFPR). In February 2020, the LFPR was 63.4%, meaning that 63.4% of the population was in the Labor Force, either employed or unemployed (i.e., actively looking for work). Currently, only 62.4% of the population is in the labor force. A full 1% of the population has decided that it isn’t in their best interest to work for one reason or another. So when the BLS calculates the unemployment rate, they can say 3.6% of the smaller “labor force” is unemployed even though it is a smaller number employed than in 2020.
See Current Employment for more info.
March 2022 Unemployment Report (Seasonally Adjusted)
 Click for a larger Image
Click here if you would like to receive this monthly report and other article updates. You can unsubscribe at any time.
Here are some articles you might enjoy if you missed them:
Read more on UnemploymentData.com.
- February Employment / Unemployment Report
- Make Your Future With A Medical Assistant Career
- Excellent Six-Figure Careers To Consider
- Create A Great Construction Job Resume For Better Responses
From InflationData.com
- February 2022 Inflation- 7.9%… Is 11% Next?
- How Should You Invest to Benefit From Inflation?
- Hyperinflation in Turkey and Argentina Today?
- January Inflation Nears 40 Year High
- Former Treasury Secretary Larry Summers on the Current Inflation Situation
- How Quickly Can The FED Get Inflation Under Control?
From Financial Trend Forecaster
- Moore Inflation Predictor
- NYSE ROC
- NASDAQ ROC
- Can Ruthless Governments Make Crypto Worthless?
- Will Russian Sanctions Open a Can of Worms?
- In What Universe is $100+ Crude Oil Cheap?
- Economic Warfare Deployed Against Russia
- The Surprising Implications Of Declining Global Birth Rates
- The Market is Currently a “Mixed Bag”
- The Journey to High-Confidence Trading Starts Now!
- Historically Investors Become “Long-term Buyers” at Precisely the Wrong Time
- Why the “60 / 40 Balance” May Be Hazardous to Your Portfolio
- Warning: Mergers And Acquisitions Can Vaporize The Stock Market
From OptioMoney.com
- Guide to Managing Small Business Finances
- Unlock The Benefits Of A Good Credit Score
- Buying A Home When You Are Already In Debt
- Top 10 Tasks Businesses Should Outsource in 2022
- 7 Unexpected Costs Of Moving To A New Home
From Your Family Finances