
![]() The U.S. Bureau of Labor Statistics (BLS) released their monthly employment survey results for the month of June on Friday July 6th .
The U.S. Bureau of Labor Statistics (BLS) released their monthly employment survey results for the month of June on Friday July 6th .
According to the BLS, the current “Seasonally Adjusted” Unemployment Rate for June (released July 6th) is 4.0% up from 3.8% in May and 3.9% in April. It was 4.1% where it was stuck from October 2017 through March 2018. Prior to October it was bouncing around between 4.3% and 4.4% since April 2017, after declining from 4.8% in January 2017.
Typically Unemployment levels are worse in June and July, so even though 213,000 more people are employed, unemployment levels still went up. (Probably because students are swelling the labor force for the summer). Last year (2017) Unadjusted Unemployment jumped from 4.1% in May to 4.5% in June while Employment went from 146.937 million to 147.578 million. So even though more people are working more people are also looking for a job. This has driven the Labor Force Participation Rate at 63.4% to levels not seen in several years. NOTE: On 8/3/2018 with the release of the new July numbers the BLS adjusted the June LFPR down to 62.9%.
Key June Employment and Unemployment Numbers
- Adjusted U-3 Unemployment- 4.0% Up from 3.8% in May, 3.9% in April but still Below the 4.1% October – March.
- Unadjusted U-3 Unemployment- 4.2% up from 3.6% in May, 3.7% in April and 4.1% in March.
- Unadjusted U-6 Unemployment- 8.1% up from 7.3% in May, 7.4% in April and from 8.1% in March and 8.6% in February.
- Employment 149.980 million up from 149.334 million in May, 148.372 million in April and 147.384 million in March.
- Gallup has discontinued publishing U-6 & U-3 numbers.
See Current Unemployment Chart for more info.
Employment by Sector
The employment “bubble chart” gives us a good representation of how each sector of the economy is doing (employment wise). As we can see from the chart below only one sector is to the left of the zero line this month indicating that all other sectors gained employees except Retail which lost -21,600 employees (technically the orange bubble i.e. Utilities on the line lost a few hundred employees as well). The big gainers were Education and Health +54,000, Professional and business Services +50,000, and Manufacturing +36,000.
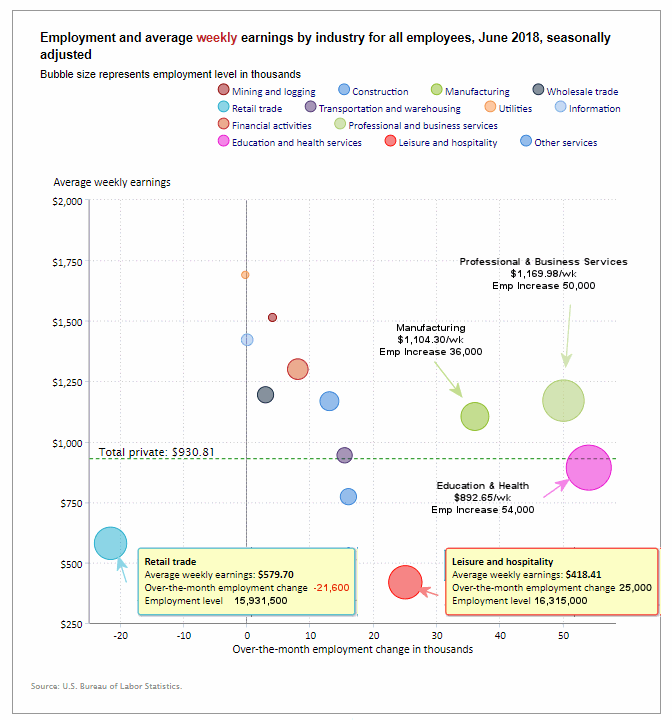
(See the table below for average weekly earnings and other details.)
How to read this chart:
Bubbles location on the chart tell us two things:
- Change in Employment Levels over the most recent month.
- Average Weekly earnings.
- The further to the right the bubble the larger the increase in the number of jobs.
- The higher up on the chart the larger the average salary.
Bubble Size tells us:
- Total Employment for the sector.
- Larger bubbles mean more people are employed in that sector.
Employment and Average Weekly Earnings by Industry for All Employees
June 2018, Seasonally Adjusted
| Industry | Monthly Increase | Average Weekly Earnings | Employment Level |
| Total Private Employment | 202,000 | $930.81 | 126,571,000 |
| Mining and Logging | 4,000 | $1,514.04 | 737,000 |
| Construction | 13,000 | $1,167.60 | 7,222,000 |
| Manufacturing | 36,000 | $1,104.30 | 12,713,000 |
| Wholesale trade | 2,900 | $1,194.11 | 5,960,800 |
| Retail trade | -21,600 | $579.70 | 15,931,500 |
| Transportation and Warehousing | 15,400 | $943.71 | 5,324,400 |
| Utilities | -300 | $1,690.25 | 553,700 |
| Information | 0 | $1,421.64 | 2,768,000 |
| Financial Activities | 8,000 | $1,300.21 | 8,576,000 |
| Professional and Business Services | 50,000 | $1,169.98 | 20,969,000 |
| Education and Health Services | 54,000 | $892.65 | 23,623,000 |
| Leisure and Hospitality | 25,000 | $418.41 | 16,315,000 |
| Other Services | 16,000 | $772.53 | 5,878,000 |
U-6 Unemployment
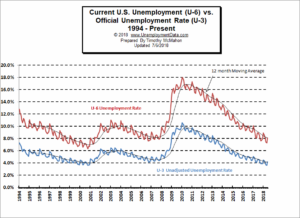 Looking at the broader measure of Unemployment which includes discouraged workers, we see that the U-6 unemployment rate rose from 7.3% in May back to 8.1% in June but remains below the 8.9% in January.
See Unadjusted U-6 unemployment for more info.
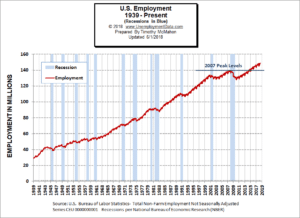
Employment
Over the last month, the actual number of people working (not seasonally adjusted) has increased by 646,000 jobs in June bringing the level to 149,980,000 up from 145,435,000 in January.
 According to the BLS Commissioner’s report for this month: “Nonfarm payroll employment rose by 213,000 in June, and the unemployment rate increased to 4.0 percent. Job gains occurred in professional and business services, manufacturing, and health care, while retail trade lost jobs.”
Labor Force Participation Rate
The LFPR for May was 62.7% down from April’s 62.8%, March was 62.9%, February was 63.0%. (Higher is better so a falling LFPR is not good). But in June the LFPR jumped dramatically to 63.4% exceeding 63.2% for the first time since 2014. NOTE: On 8/3/2018 with the release of the new July numbers the BLS adjusted the June LFPR down to 62.9%.
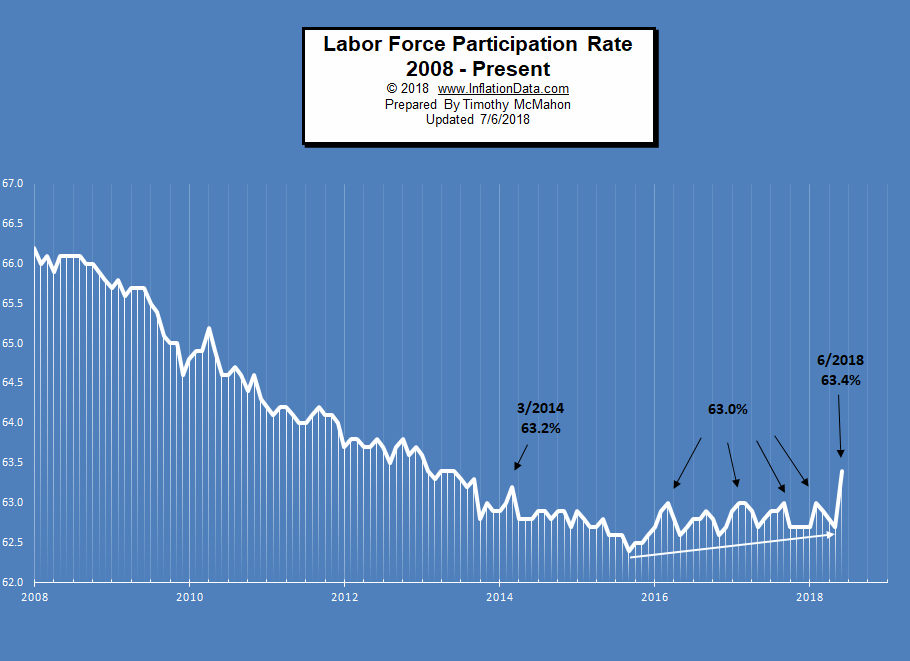
See Labor Force Participation Rate for more information.
For more information See:
- Article: Employment vs. Unemployment how do they compare?
- Historical Employment Data Chart
- Current Unemployment Rate Chart
- Current Employment vs Unemployment Chart Are they really “two sides of the same coin”?
- What is U-6 Unemployment?
- The Misery index measures inflation plus unemployment and is a good measure of the discomfort of the country’s population.
- More Unemployment and Employment Charts