
![]()
Early Indicators of possible recession appeared in the June jobs report, but you have to look closely to find them in reports by the mainstream media.
- Adjusted U-3 was Unchanged at 3.6%
- Unadjusted U-3 was Up from 3.4% to 3.8%
- Unadjusted U-6 was Up from 6.7% to 7.0%
- Unadjusted Employment rose from 150.964 to 151.773 million
- Average Weekly Wages Still Rising
Early Warning Negative Indicators
Early Indicators of a possible recession
- Labor Force Participation Down from 62.3% to 62.2%
- Upturn in Uneducated Unemployment
- Rising Unemployment among the newly unemployed
- Average Weekly Hours among manufacturing workers falling
According to the Commissioner of the U.S. Bureau of Labor Statistics:
“Total nonfarm payroll employment rose by 372,000 in June, and the unemployment rate remained at 3.6 percent, the U.S. Bureau of Labor Statistics reported today.
Notable job gains occurred in professional and business services, leisure and hospitality, and health care.
The unemployment rate was 3.6 percent for the fourth month in a row, and the number of unemployed persons was essentially unchanged at 5.9 million in June. These measures are little different from their values in February 2020 (3.5 percent and 5.7 million, respectively), prior to the coronavirus (COVID19) pandemic.”
You can read the full BLS report here.
As usual, they are talking about “Seasonally Adjusted Jobs” from the “Household Survey” rather than looking at the results reported by actual companies in the BLS “Establishment Survey.”
But looking at the Establishment Survey report, we see…
Initially, the BLS reported employment of 151.773 million for May, which they adjusted to 151.748 million. So 25,000 jobs disappeared in May. They are reporting 152.692 million jobs for June, which is an increase of 919,000 based on their original estimates or an increase of 944,000 based on their updated numbers.
The latest Job Openings and Labor Turnover Survey, released on Wednesday, showed there were 11.3 million job openings in May, or 1.9 positions for every job seeker, and historically low levels of layoffs… But, the BLS reported that initial jobless claims for the week ending July 2 totaled 235,000, an increase of 4,000 from the prior week’s reading and the highest level since mid-January… New job cuts data released Thursday by Challenger, Gray & Christmas revealed that US employers announced 32,517 layoffs in June, a 58.8% increase from the same month last year, and the highest monthly total since February 2021.
According to the Washington Post:
The strong job growth keeps pressure on the Fed to continue raising interest rates when it meets later this month. After years of keeping interest rates at or near zero, the central bank has so far hiked rates three times this year, by a total of 1.5 percentage points, in the hope of slowing the economy just enough to curb inflation, which is at 40-year highs, without pushing it into a deep recession.
Recession Ahead?
The Federal Reserve Bank of Atlanta estimated that the economy shrank by 1.2 percent in the second quarter, which would put the U.S. in a recession by one common definition i.e. two consecutive quarters of economic contraction. But the National Bureau of Economic Research, the nonprofit organization that is the official arbiter of recessions, also includes unemployment in their calculations, so according to their definition, there is no recession yet.
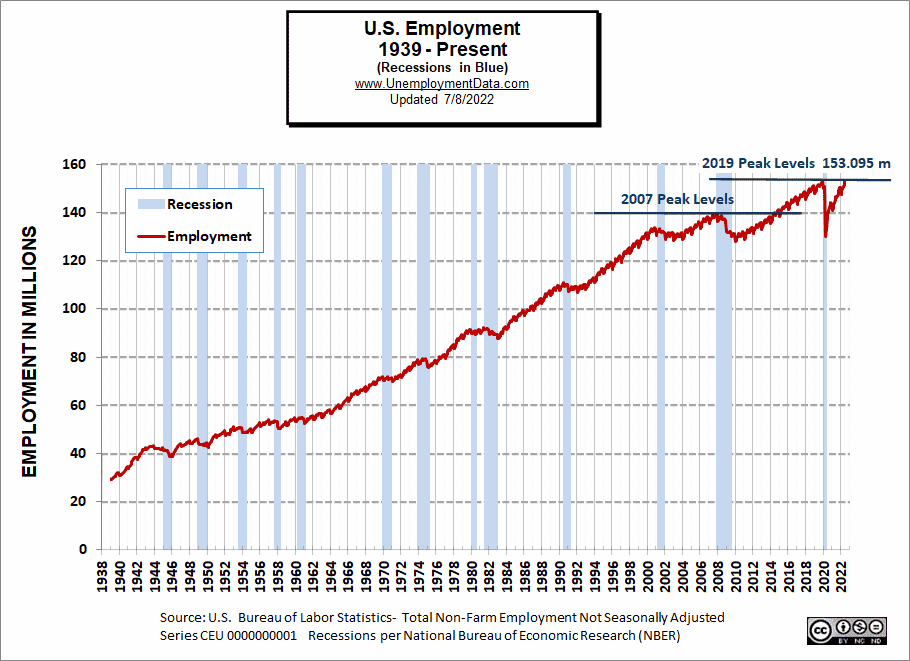
Employment is almost back to 2019 peak levels (although the civilian population is about 4 million higher now).
Early Indicators of Possible Recession
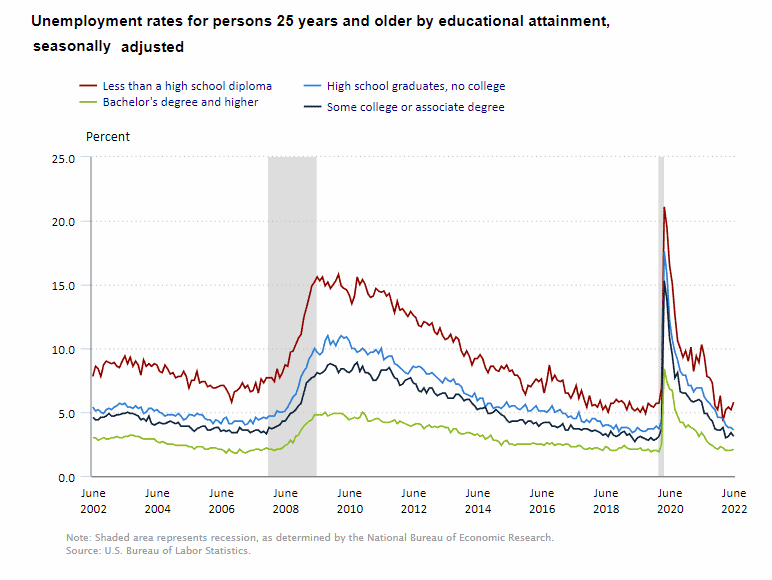
June 2022 Unemployment by Education
Unemployment among College grads increased slightly to 2.1%, those with some college rose from 3.1% in April to 3.3% in May but fell back to 3.1% in June, while those with less than a High School diploma fell from 5.4% in April to 5.2% in May but rose to 5.8% in June. The upturn in uneducated unemployment could be an early indicator of trouble brewing in the economy.
 Source: BLS
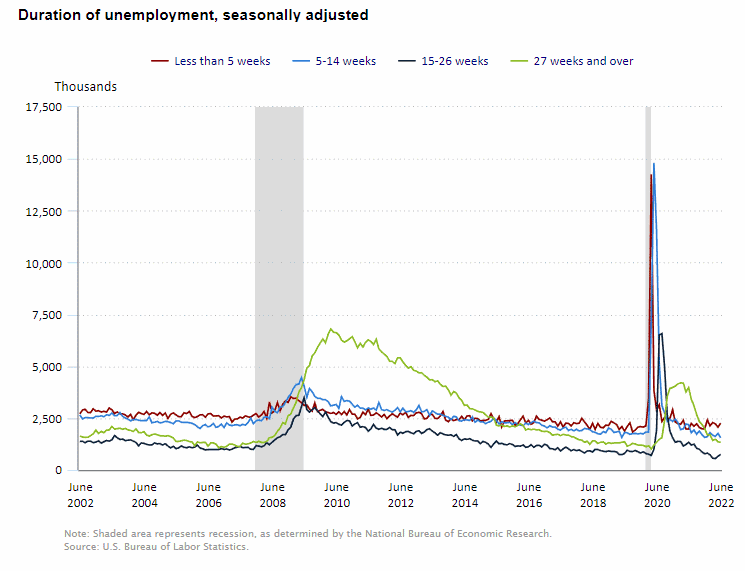
Duration of Unemployment
Unemployment among the newly unemployed, i.e., less than 5 weeks, rose in June, as did those jobless for 15-26 weeks.
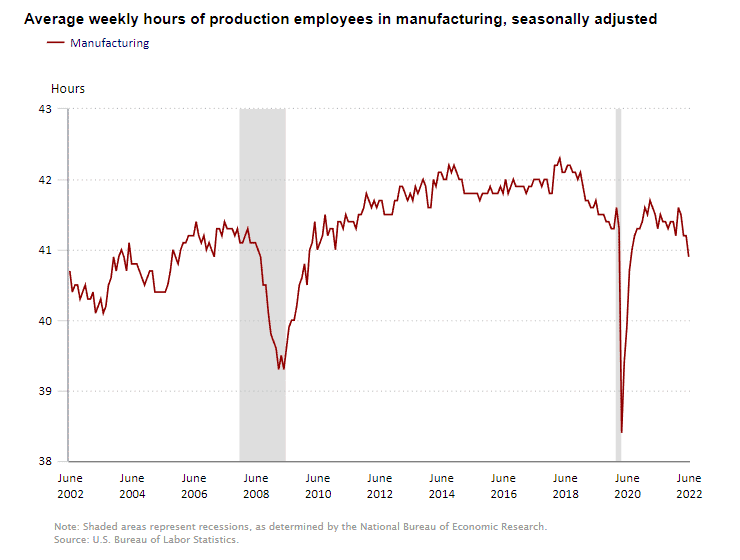
Average Weekly Hours
Apparently, manufacturing companies aren’t pushing their employees as hard as they have been since the average hours worked are beginning to fall. This could be another early indicator of a recession brewing.
Employment / Population Ratio
As we can see in the Employment-Population Ratio from May through July 2020, the Employment-Population ratio rebounded from 52.8% to 55.1%. Then the Employment / Population ratio rose steadily throughout 2021, so by May 2021, it was 58.0%. It increased slowly until December when it reached 59.5%. Through 2022, the employment-population ratio has been relatively flat.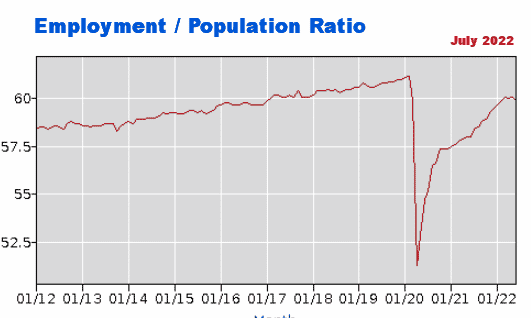
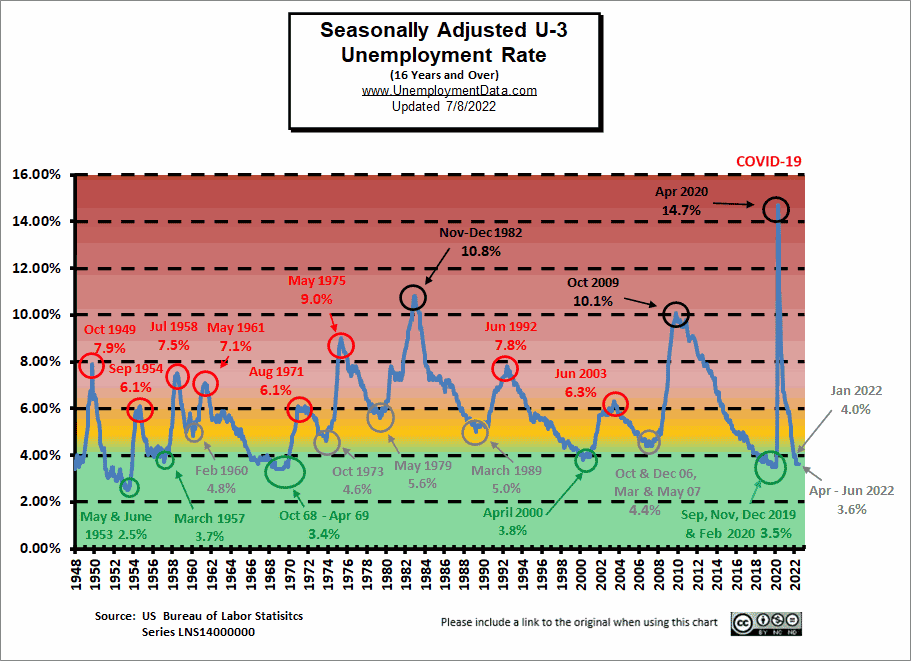
Unemployment Still Historically Low
Unemployment levels are in historically low territory. After all, the FED did pump unprecedented TRILLIONS into the economy to get us to this place.
See: FED Actions for more info.
But we can see that Seasonally Adjusted U-3 is definitely in the “Green” territory.
 Click for a larger Image
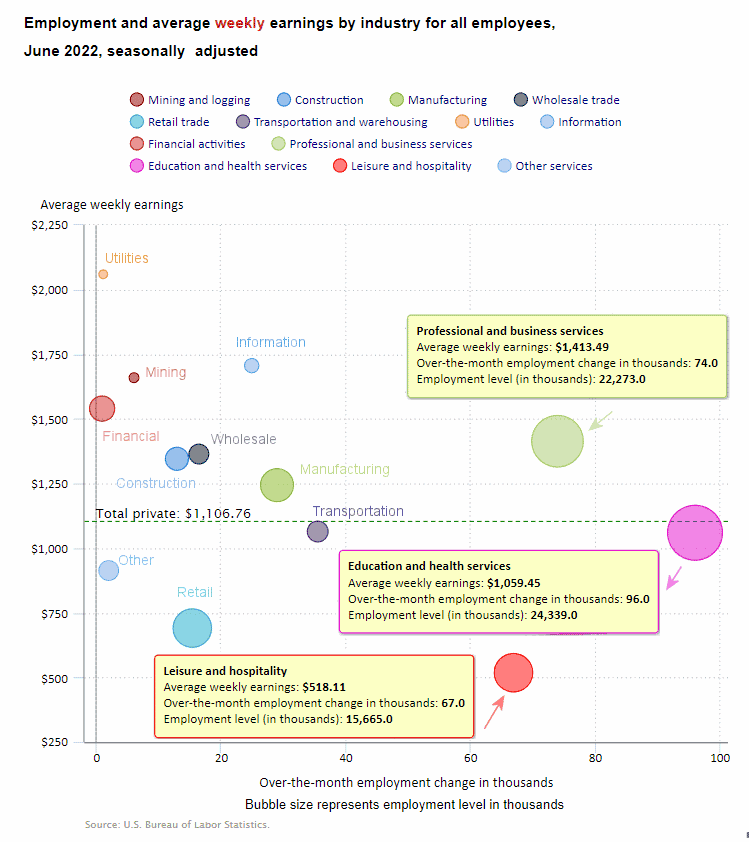
June 2022 Employment by Sector
The employment “bubble chart” is a quick and easy way to see how each sector performs on a seasonally adjusted basis. The Bubble’s Size tells us the total Employment for that industry (i.e., larger bubbles mean more people are employed in that sector).
The bubble’s location on the chart tells us that there has been a change in Employment Levels over the most recent month… A bubble further to the right indicates larger job growth. A bubble’s vertical location on the chart shows the average industry salary.
The tight Labor Market is still putting upward pressure on wages.
Average Weekly Wages Still Rising $1,106.76, up from $1,105.47 in May and $1,102.01 in April, and $1,086.46 in December 2021.
 Click for a larger image.
Remember, these are Seasonally Adjusted Numbers, so they aren’t cumulative! Every sector gained jobs this month. Education and Health Services was the largest gainer with 96,000 new jobs, Professional and Business Services gained 74,000 jobs. Leisure and Hospitality was the third-largest gainer with 67,000 new jobs.
Employment and Average Weekly Earnings by Industry
June 2022, Seasonally Adjusted Employment
| Industry | Monthly Increase | Average Weekly Earnings | Employment Level |
| Total Private Employment | 381,000 | $1,106.76 | 129,765,000 |
| Mining and Logging | 6,000 | $1,659.22 | 625,000 |
| Construction | 13,000 | $1,345.58 | 7,670,000 |
| Manufacturing | 29,000 | $1,243.66 | 12,797,000 |
| Wholesale trade | 16,400 | $1,363.83 | 5,874,000 |
| Retail trade | 15,400 | $690.67 | 15,777,500 |
| Transportation and Warehousing | 35,500 | $1,064.25 | 6,553,800 |
| Utilities | 1,100 | $2,059.29 | 540,800 |
| Information | 25,000 | $1,705.89 | 3,008,000 |
| Financial Activities | 1,000 | $1,539.75 | 8,951,000 |
| Professional and Business Services | 74,000 | $1,413.49 | 22,273,000 |
| Education and Health Services | 96,000 | $1,059.45 | 24,339,000 |
| Leisure and Hospitality | 67,000 | $518.11 | 15,665,000 |
| Other Services | 2,000 | $913.19 | 5,691,000 |
Annual Employment Change by Industry
Looking at Employment Change by Industry over the last 12 months, we can see that Government gained 190,000 jobs over the year (although they lost -9,000 over the month.)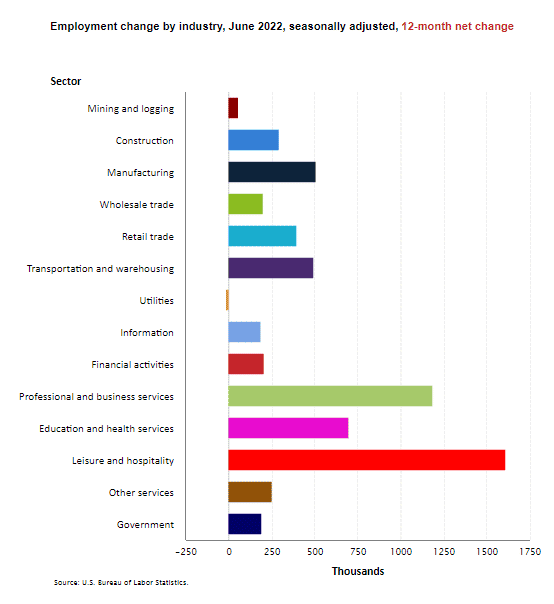
June 2022 Labor Force Participation Rate
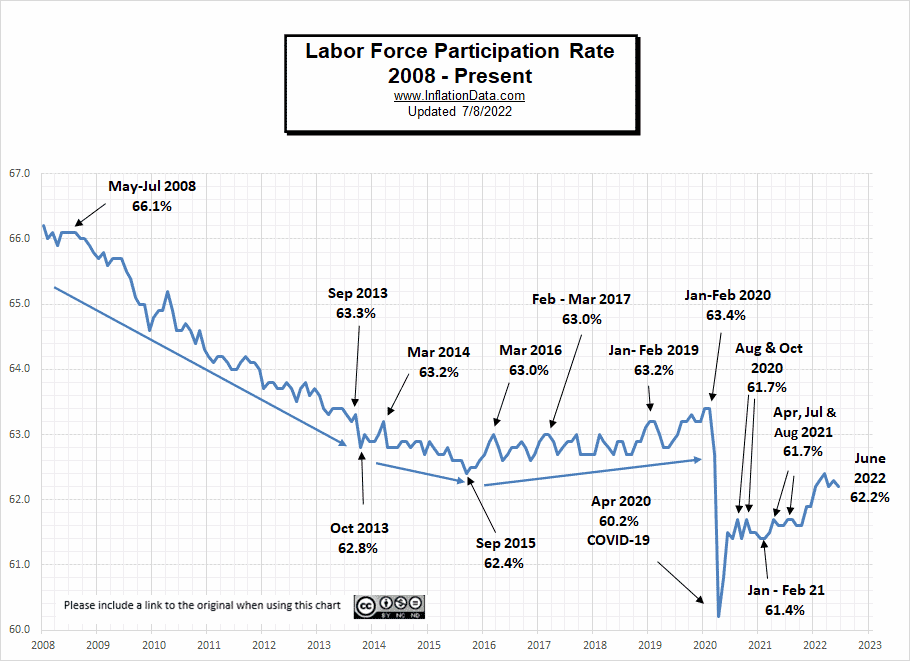 LFPR ticked down 1/10th% in June after being up that amount in May but is still more than an entire percentage point below Jan-Feb 2020 levels, possibly indicating a permanent departure from the labor force by one spouse in order to be more active in their children’s lives and education.
See Labor Force Participation Rate for more information.
Seasonally Adjusted U1 through U6 Unemployment Rates
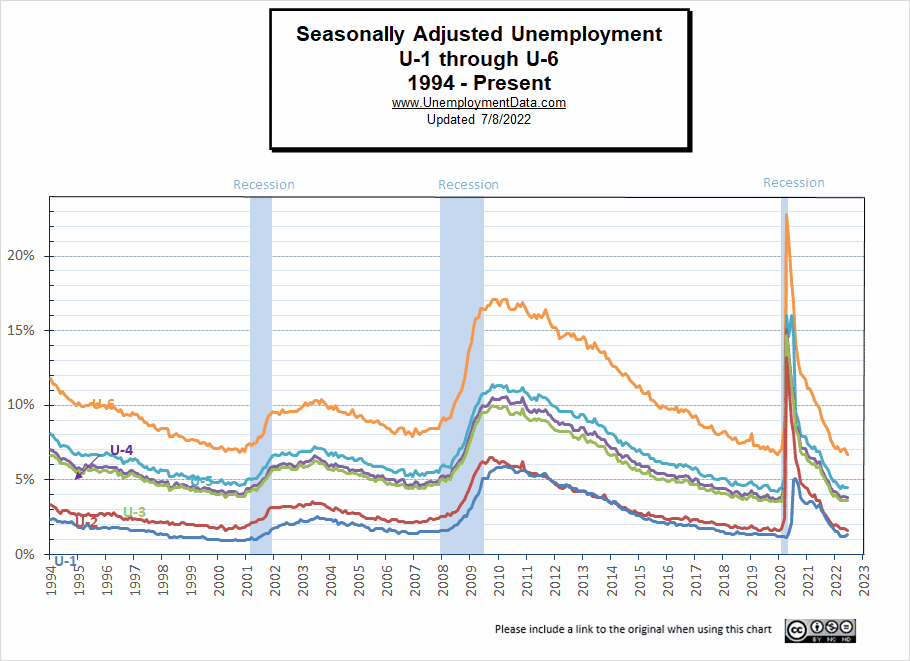
For more information about the various measurements of unemployment, see What Is U-6 Unemployment?
June 2022 Employment
June 2022 employment remains above December 2021 but is still marginally below November 2019 levels, plus the Civilian Non-Institutional Population has increased by over 4 million since then.
See Current Employment for more info.
ADP National Employment Report
In addition to the BLS, we can look at the Jobs Report generated by private companies like ADP Research Institute. Unfortunately, due to the holiday, the ADP report for June is not out yet.
Click here if you would like to receive this monthly report and other article updates. You can unsubscribe at any time.
Here are some articles you might enjoy in case you missed them:
Read more on UnemploymentData.com.
- May 2022- Unemployment by State
- May Employment Up – Unemployment Unchanged
- How Is Time Management Important In The Workplace?
- Top Cities for Gig Worker Opportunities
- April Unemployment Holds Steady
From InflationData.com
- The Many Evils of Inflation
- July 4th Cookout Will Cost You 17% More in 2022
- Surprise, Surprise, The FED Raises Rates by .75%
- Inflation Takes a Bite Out of Your Food Budget
- Inflation Adjusted Gasoline Hits New High
- Worldwide Inflation by Country 2022
- Analyzing 5 Ways You Can Hedge Against Surging Inflation
From Financial Trend Forecaster
- Moore Inflation Predictor
- NYSE ROC
- NASDAQ ROC
- How Low Can the S&P 500 Go?
- France’s War on Terror Uses Eagles to Catch Drones
- The Fed’s New “Tightening” Plan Is Too Little, Too Late
- Keynesians and Market Monetarists Didn’t See Inflation Coming
- Elon Musk Ambushes Twitter
- Can Ruthless Governments Make Crypto Worthless?
- Will Russian Sanctions Open a Can of Worms?
- In What Universe is $100+ Crude Oil Cheap?
- Economic Warfare Deployed Against Russia
- The Surprising Implications Of Declining Global Birth Rates
- The Dow 8 Waves are Incomplete
- What to Make of the Stock Market’s Bounce
- Is the Correction Over Yet?
- Why Investors are Consistently Fooled by the Stock Market
- Is Bitcoin Headed to Zero?
From OptioMoney.com
- Financial Mistakes to Avoid After College
- Common Tax Mistakes That You Need To Avoid
- 6 Passive Income Ideas to Grow Your Wealth
- Surprising Ways a Storage Unit Can Save You Money
- Guide to Managing Small Business Finances
From Your Family Finances