
The U.S. Bureau of Labor Statistics (BLS) released its employment / unemployment report for July on August 4th 2023.
Adjusted Unemployment down Slightly
![]()
- Adjusted U-3 was 3.5% down from 3.6%
- Unadjusted U-3 was 3.8% unchanged
- Unadjusted U-6 was 7.1% down from 7.2%
- Labor Force Participation unchanged at 62.6%
- Unadjusted Employment fell from 156.945 to 156.126 million
Summary:
Despite the fact that the adjusted U3 unemployment rate was down, and they claim more people were working
there were actually fewer people working in July than in June.
Total Employed went down from 156.945 million in June to only 156.126 million in July.
According to the Commissioner of the U.S. Bureau of Labor Statistics:
“Total nonfarm payroll employment rose by 187,000 in July, and the unemployment rate changed little at 3.5 percent, the U.S. Bureau of Labor Statistics reported today. Job gains occurred in health care, social assistance, financial activities, and wholesale trade.”
You can read the full BLS report here.
As usual, they are talking about “Seasonally Adjusted Jobs”.
Looking at the Unadjusted Employment Statistics Program (Formerly the Establishment Survey report) we see…
Originally the BLS reported employment of 155.963 million for June, which they adjusted to 156.945 million. So they subtracted 18,000 jobs for June. They are reporting 156.126 million jobs for July which is actually a decrease of 837,000 jobs based on their original estimates or a decrease of 819,000 based on their updated numbers.
BLS Source
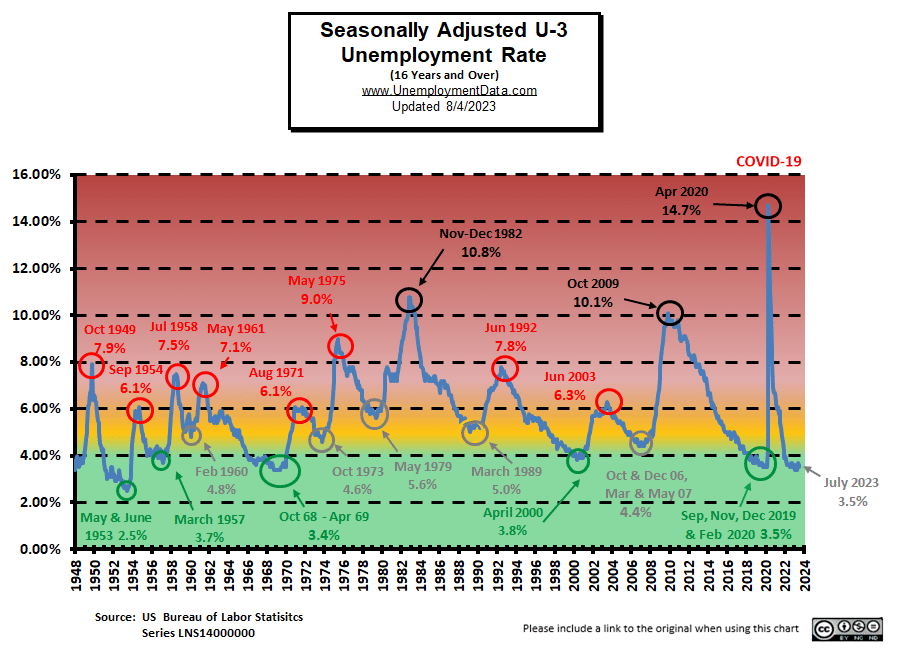
Current Employment Rate Chart
Adjusted Unemployment is at the pre-COVID 2019 cyclical lows of 3.5%. We’ve been saying that “typically, March or April has one of the lowest unemployment rates for the year, so we could see a slight increase from here without an actual deterioration of the labor market.” And that is what happened before dropping slightly in July. Current levels are still within the “Green Zone”.
Full Employment?
For several months now, we’ve been talking about “full employment”:
Full Employment is when everyone who wants a job has one. It is generally considered to be slightly above 3%. Although, other factors, such as unemployment benefits, can shift the level higher or lower. So, if unemployment benefits are extended from 6 months to 1 year, people will tend to stay unemployed longer, thus raising the unemployment rate. Of course, as the population grows, there is no “full employment” in numerical terms, just in percentage terms.
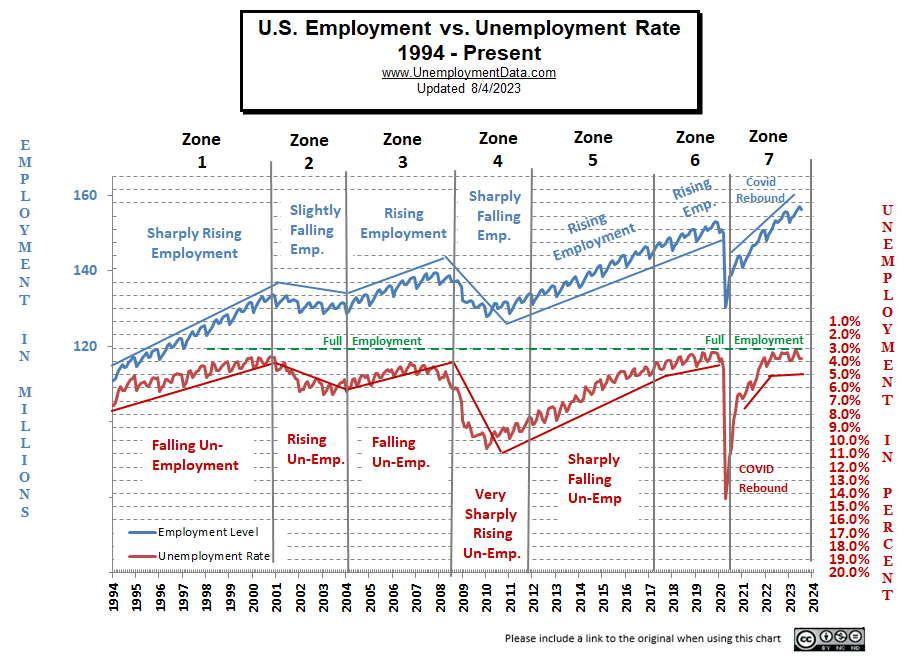
After the unemployment rate almost touched the magic full employment line in April, it began moving away (i.e., higher unemployment). If this continues into the fall months, it could be the beginning of a recession. However, as we’ve said, the Summer months tend to have higher unemployment, so this is perfectly normal.
Note: The Unemployment rate is inverted to track the employment rate. Neither is Seasonally Adjusted.
Full employment is not considered to be at zero percent because even when employers are having difficulty finding employees, some people are still unemployed due to either structural unemployment (mismatch between worker skills and job requirements, i.e., not enough training) or simply because they quit their job knowing it would be easy to find another (hopefully better) job. Often referred to as frictional unemployment (there will always be people who have quit or have lost a seasonal job and are in the process of getting a new job). See: Highly Skilled Worker Shortage in a Recession?
If the unemployment rate stays constant, but more people are working, where are these extra workers coming from?
Somehow the workforce has to be growing to accommodate these newly created jobs. They could be long-term unemployed (no longer counted in the workforce) returning to the workforce, they could be immigrants entering the workforce, or possibly retired people coming out of retirement because of an offer too good to turn down. This is generally facilitated by rising wages, but this month’s ADP report indicates that wage growth has slowed, possibly indicating that we are nearing the end of this boom.
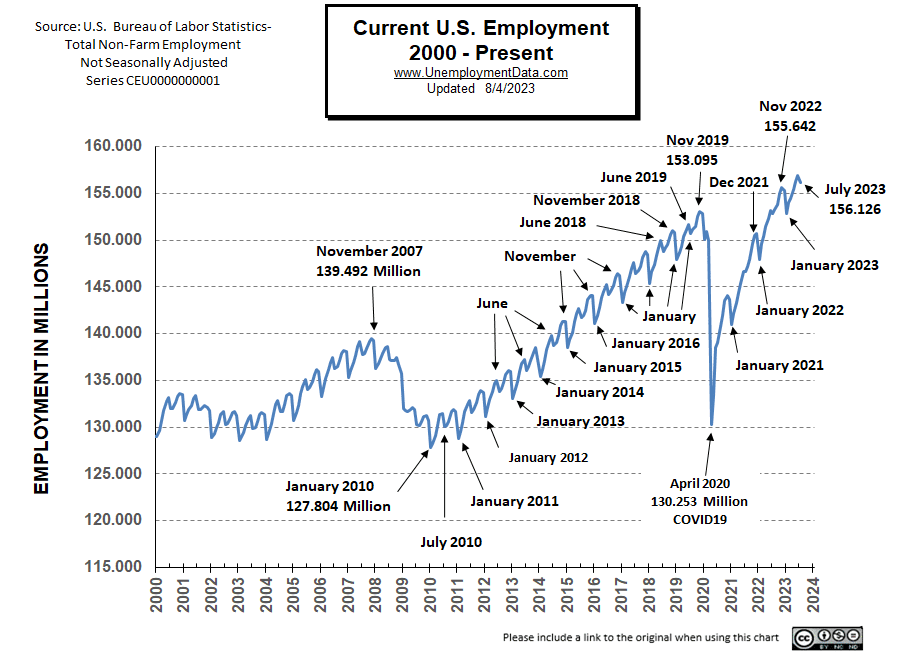
Current Employment Rate
Employment 3.251 million Above Year-Ago Levels
and 5.158 million above February 2020 (prior to the Covid Crash)
But the Civilian Population has increased by about 7.374 million since February 2020.
Although down for the month, at 156.126 million, July Employment is still above the November 2022 peak employment level of 155.642 million. In January 2023, we had the typical drop taking employment slightly below the 2019 peak. In June, employment at 156.945 million was above the November 2022 peak. And in July we got the typical slight drop to 156.126 million.
 See Current Employment for more information.
ADP® National Employment Report
ADP provides an independent (non-government) estimate of private-sector employment and pay, based on data derived from ADP client payrolls. According to ADP®, In collaboration with Stanford Digital Economy Lab.
ADP: Private employers added 324,000 jobs in July
- Job creation remained robust in July, with leisure and hospitality again driving growth. One weakness was manufacturing, an interest rate-sensitive industry that shed jobs for the fifth straight month.
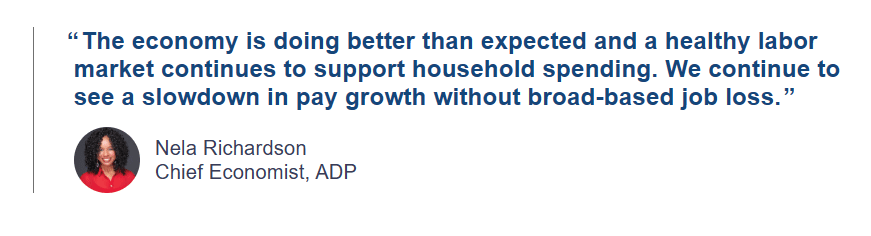
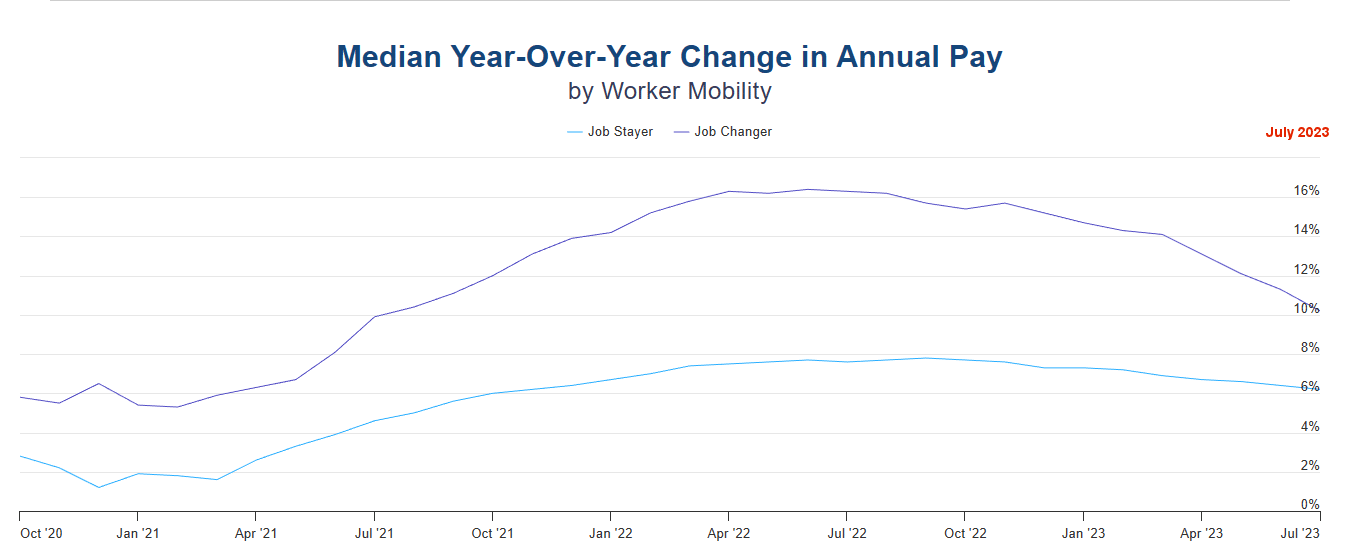
As she’s been saying for several months, Ms. Richardson is saying that although employers are still hiring, upward pressure on salaries is easing. As we can see in the following chart, although job changers are still getting a 10+% boost in pay, that is well below the 16+% boost they would get a year ago. And those who stayed in their same jobs, saw a roughly 6.2% increase in salaries compared to 7.6% a year ago.
 Source: ADP® Pay Insights
Private Employment Trends
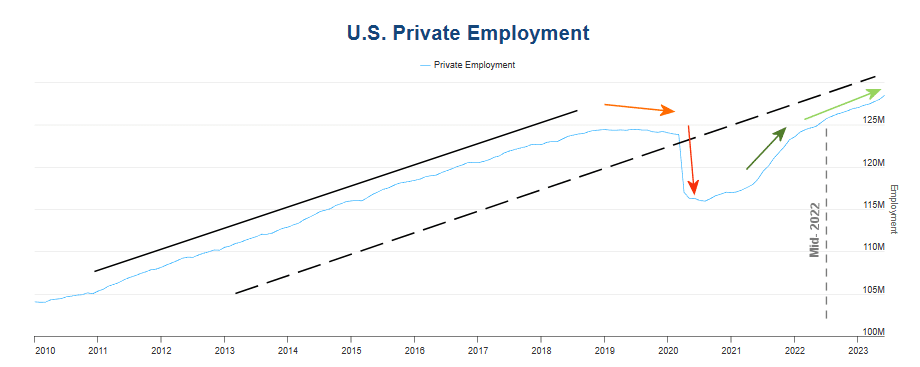
I’ve added a few lines and arrows to the ADP employment chart. The slope of the solid black line represents the rate of increase in jobs from 2011 through mid-2018. Then the rate of increase dropped off and total employment slightly decreased (orange arrow). The red arrow is the COVID crash in employment. Then the dark green arrow shows the rapid recovery of jobs. By Mid-2022, employment was back at pre-COVID levels. The dotted line has the identical slope as the black line. So, we can see that since mid-2022 employment has been on the exact same trajectory as it was from 2011 to 2018, with perhaps even a slight upturn in June/July.
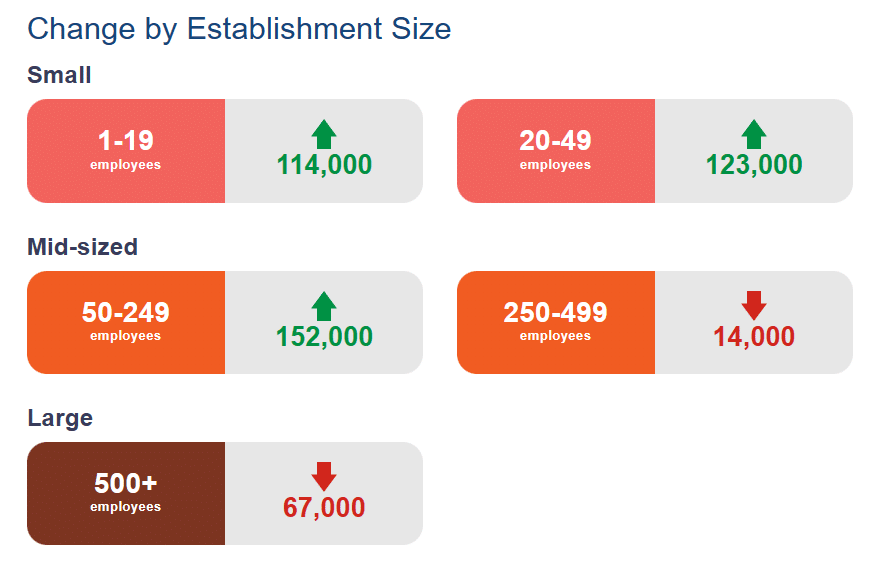
ADP Private Employment by Firm Size
ADP also lists increases by “firm size”.
This month, small and mid-size companies added employees, while Large companies downsized a slight bit.
July ADP Changes:
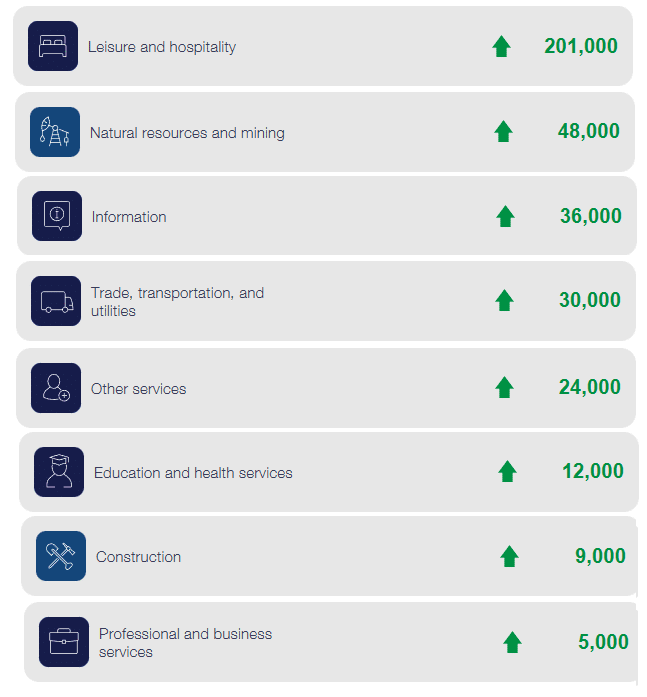
ADP Job Gainers
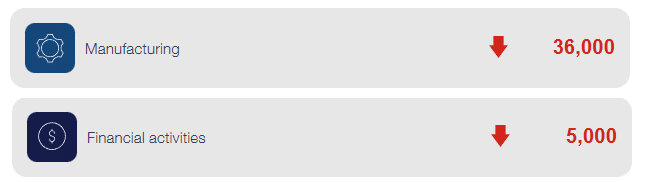
According to ADP, most sectors gained employees in July with Leisure and Hospitality massively leading the pack followed by Mining.
ADP Job Losers
As far as the industry sectors are concerned, in April there were only three sectors that lost employees, May had five, June had four and July only had 2 losing sectors.
BLS: July 2023 Employment by Sector
The BLS employment “bubble chart” gives us a slightly different picture than the ADP does. The Bubble’s Size tells us the total Employment for that industry (i.e., larger bubbles mean more people are employed in that sector).
The bubble’s location on the chart tells us that there has been a change in Employment Levels over the most recent month… A bubble further to the right indicates larger job growth. A bubble’s vertical location on the chart shows the average industry salary.
Remember, these are Seasonally Adjusted Numbers, so they aren’t cumulative!
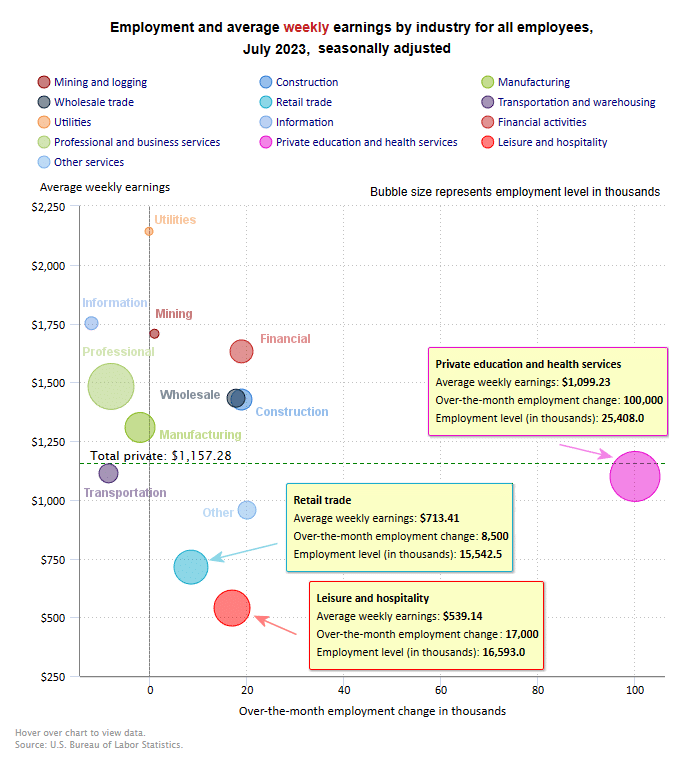
According to ADP, Leisure & Hospitality gained 201,000 jobs in July, but according to the BLS, they only gained 17,000. According to the BLS the largest gainer was not Leisure & Hospitality but rather Education & Health, with an increase of 100,000 jobs.
BLS Average Weekly Wages
| Date | Average Weekly Wage |
| July 2023 | $1,157.28 |
| June 2023 | $1,155.15 |
| May 2023 | $1,146.99 |
| April 2023 | $1,147.58 |
| March 2023 | $1,141.34 |
| February 2023 | $1,141.61 |
| January 2023 | $1,146.14 |
| December 2022 | $1,125.73 |
| November 2022 | $1,129.01 |
| October 2022 | $1,124.01 |
| September 2022 | $1,119.87 |
| August 2022 | $1,116.42 |
| July 2022 | $1,116.54 |
| June 2022 | $1,106.76 |
| May 2022 | $1,105.47 |
| April 2022 | $1,102.01 |
| December 2021 | $1,086.46 |
BLS Employment and Average Weekly Earnings by Industry
July 2023, Seasonally Adjusted Employment
We’ve added a column to the table below showing the employment levels the BLS reported the previous month. Note that due to “seasonal adjusting,” although they may claim that there was a “monthly increase” (or decrease), there isn’t always an actual increase; you can’t just subtract last month’s “employment level” from this month’s level. For instance, Construction was supposed to have 7,947,000 employees in June and have a 19,000 “increase”, but in July, there were 7,971,000 employed. That looks like a 24,000 increase to me. And Professional and Business Services went from 23,054,000 June to 23,032,000 in July for a seasonally adjusted -8,000 decrease, but it seems like an -22,000 decrease to me.
| Industry | July Monthly Increase | July Ave. Weekly Earnings | July Employment Level | June Employment Level |
| Total Private Employment | 172,000 | $1,157.28 | 133,641,000 | 133,494,000 |
| Mining and Logging | 1,000 | $1,706.43 | 643,000 | 642,000 |
| Construction | 19,000 | $1,426.46 | 7,971,000 | 7,947,000 |
| Manufacturing | -2,000 | $1,307.66 | 12,985,000 | 12,989,000 |
| Wholesale trade | 17,900 | $1,432.30 | 6,063,800 | 6,047,000 |
| Retail trade | 8,500 | $713.41 | 15,542,500 | 15,539,000 |
| Transportation and Warehousing | -8,400 | $1,112.38 | 6,721,500 | 6,730,000 |
| Utilities | -200 | $2,142.14 | 557,100 | 556,600 |
| Information | -1,200 | $1,751.11 | 3,074,000 | 3,095,000 |
| Financial Activities | 19,000 | $1,631.25 | 9,163,000 | 9,144,000 |
| Professional and Business Services | -8,000 | $1,482.27 | 23,032,000 | 23,054,000 |
| Private Education and Health Services | 100,000 | $1,099.23 | 25,408,000 | 25,302,000 |
| Leisure and Hospitality | 17,000 | $539.14 | 16,593,000 | 16,576,000 |
| Other Services | 20,000 | $956.02 | 5,887,000 | 5,872,000 |
Source: BLS
Note: As usual, ADP has an entirely different picture. See Above.
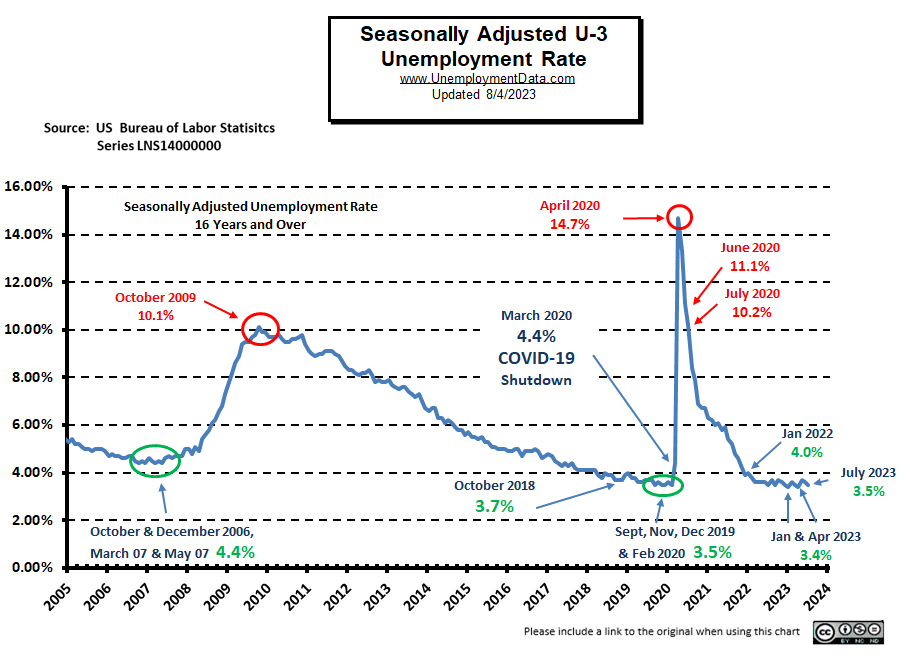
Unemployment
July’s Seasonally Adjusted Unemployment is 3.5%, down from 3.6% in June.
 July 2023 Labor Force Participation Rate
The LFPR is unchanged again at 62.6%.
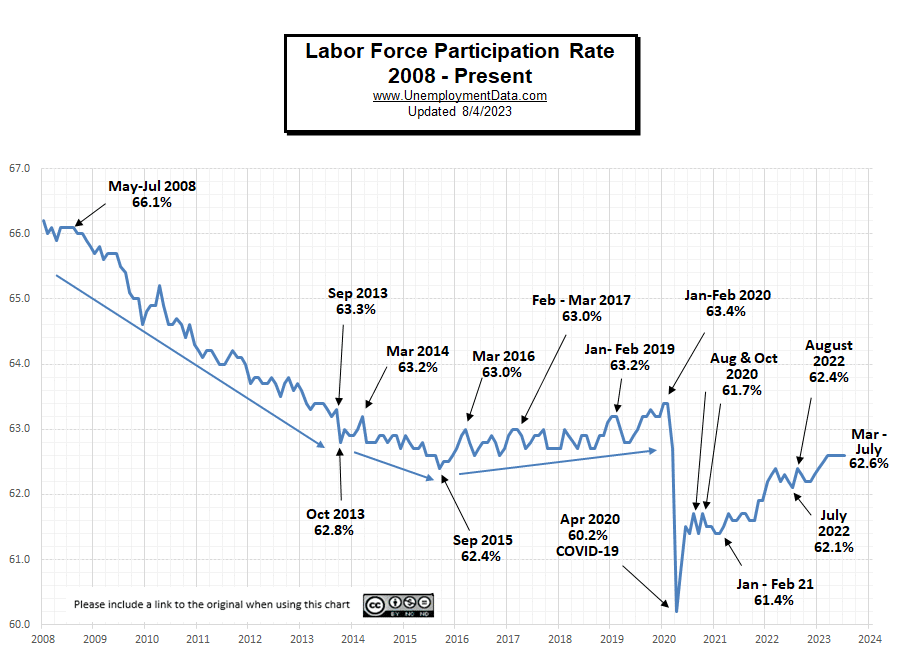 See Labor Force Participation Rate for more information.
Seasonally Adjusted U1 through U6 Unemployment Rates
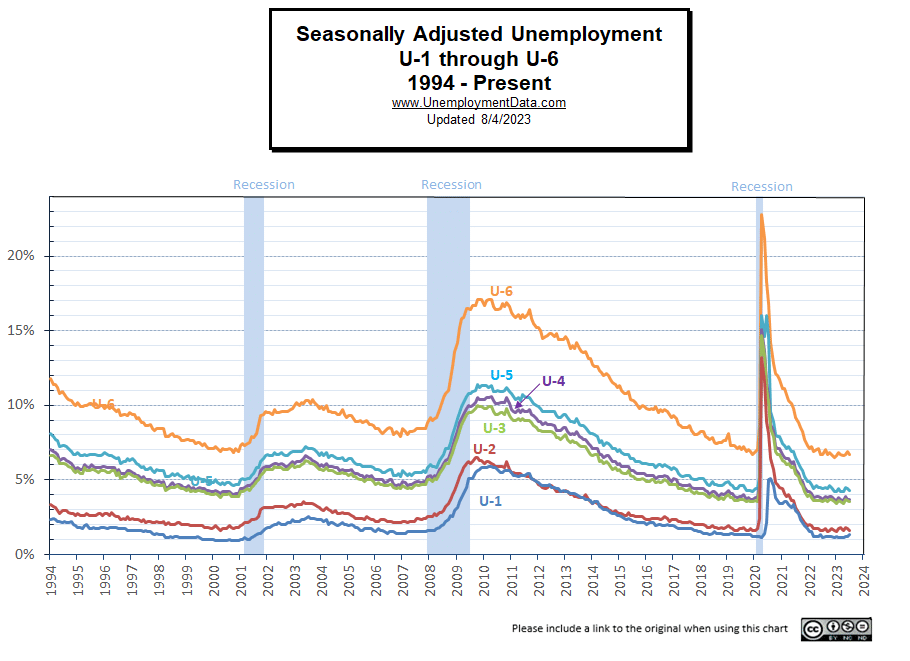 For more information about the various measurements of unemployment, see What Is U-6 Unemployment?
Seasonally Adjusted Unemployment by Education
For three months in a row, unemployment by the uneducated rose but in July it fell sharply.
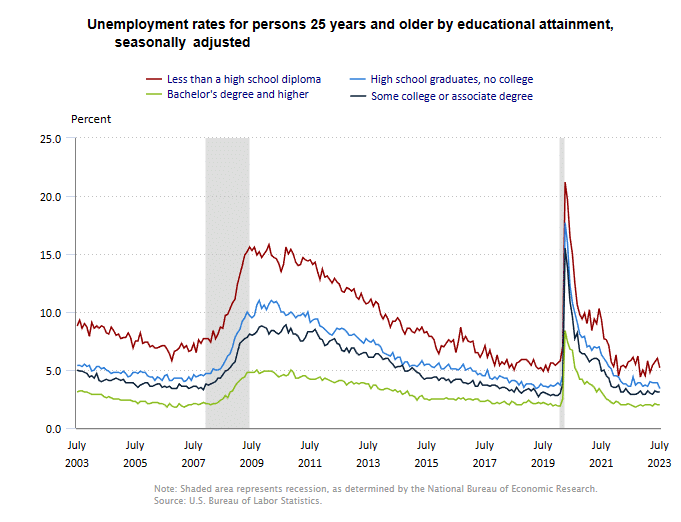 Source: BLS
Duration of Unemployment
Long-term unemployment (over 27 weeks) remains low, but 15-26 week unemployment ticked up again this month.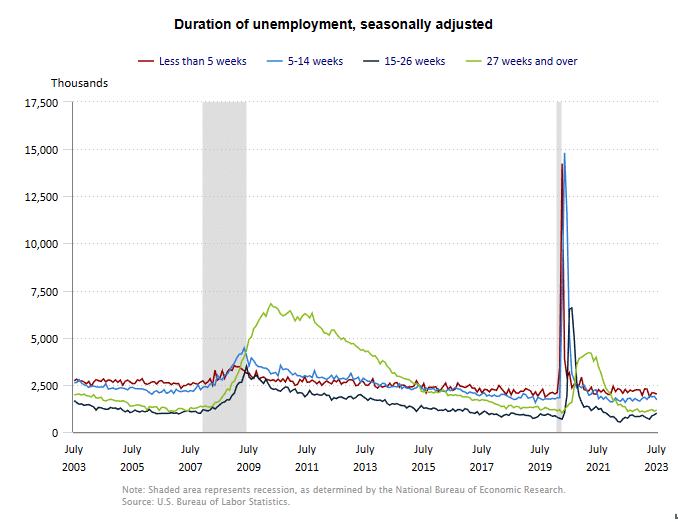
Employment-Population Ratio
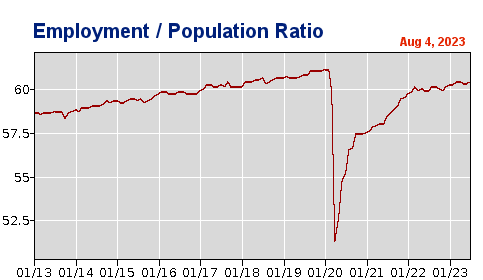
The Employment / Population ratio fell from April’s 60.4% of the population employed to 60.3% in May and June. In July it returned to 60.4%.
See Employment Population Ratio for more information
Read more on UnemploymentData.com.
- Things to Look for When Locating Your Business
- What to Do When Your A/C Gives Out at Work
- Construction Consultants: What Are They and How to Work With Them
- Yet Another Month of Questionable Federal Jobs Data as 310,000 Fewer People Report Having Jobs
From InflationData.com
- Do Private Corporations Cause Inflation?
- No Surprise… FED Raised Rate by 1/4%
- How Inflation Impacts Merchants
- What is the Difference between the CPI-U and the CPI-W
- Radical Decentralization: the Key to Wealth and Freedom
- The Effects of Raising the Debt Ceiling
From Financial Trend Forecaster
- Moore Inflation Predictor
- NYSE ROC
- NASDAQ ROC
- Deepest Yield Curve Inversion Since 1981
- Is this the End of Fractional Reserve Banking?
- A Guide to Good Money
- Does Science Shape Economic Progress?
- There is No Such Thing as a “Natural” Monopoly
- The Eurozone Falls into Recession as “Stimulus” Fails
- Quick Takes on Big Financial Trends
- Extremely Rare Market Signal Just Triggered
- Stocks and Junk Bonds: “This Divergence Appears Meaningful”
From OptioMoney.com
- The Art of DIY: Saving Money by Learning New Skills
- Smart Ways to Save Money on Everyday Expenses
- Simple Ways to Improve Your Relationship with Money
- Smart Ways to Avoid Financial FOMO
- How Buying a House Affects Your Finances
From Your Family Finances