
Typically July Jobs Reports aren’t that great anyway so “Seasonal Adjustments” correct for that but let’s dig a bit deeper today.
![]()
- Adjusted U-3 was Down from 3.6% in June to 3.5% in July.
- Unadjusted U-3 was Unchanged at 3.8% for June and July after being 3.4% in May.
- Unadjusted U-6 went from 6.7% in May to 7.0% in June to 7.2% in July.
- Unadjusted Employment FELL from 152.634 million to 152.249 million.
- Average Weekly Wages Still Rising
Looking Back:
Last month (for June) we reported the following “Early Indicators of a possible recession”
- Labor Force Participation Down from 62.3% to 62.2%
- Upturn in Uneducated Unemployment
- Rising Unemployment among the newly unemployed
- Average Weekly Hours among manufacturing workers falling
July’s Indicators
According to CNBC:
“Hiring in July was far better than expected, defying multiple other signs that the economic recovery is losing steam, the Bureau of Labor Statistics reported Friday.”
One of those “other signs” is the two consecutive quarters of falling GDP. This is definitely a sign of a slowing economy, but we have typically followed the National Bureau of Economic Research, i.e. NBER’s guidance of when a recession starts. Because that includes a variety of other factors (including unemployment) giving a fuller picture of the total economy, not just GDP. But NBER typically takes a while before they declare that a recession began months ago.
But… one reason the Employment situation is as good as it is, is because of the massive injection of FED funny money over the last two years which artificially boosted the economy.
According to CNN:
“The US economy has now regained all jobs lost during the pandemic, after a blowout July jobs report that showed a gain of 528,000 jobs, according to data released Friday by the Bureau of Labor Statistics. The massive monthly gain was more than double the 250,000 that economists were expecting, according to Refinitiv.”
According to the Commissioner of the U.S. Bureau of Labor Statistics:
“Nonfarm payroll employment increased by 528,000 in July, and the unemployment rate edged down to 3.5 percent. Job growth was widespread, led by gains in leisure and hospitality, professional and business services, and health care. In July, both total nonfarm employment and the unemployment rate returned to their February 2020 pre-pandemic levels. Private-sector employment is 629,000 higher than in February 2020, although several sectors have yet to recover. Government employment is 597,000 lower than its pre-pandemic level.”
You can read the full BLS report here.
As usual, they are talking about “Seasonally Adjusted Jobs” from the “Household Survey” rather than looking at the results reported by actual companies in the BLS “Establishment Survey”.
But looking at the Establishment Survey report we see…
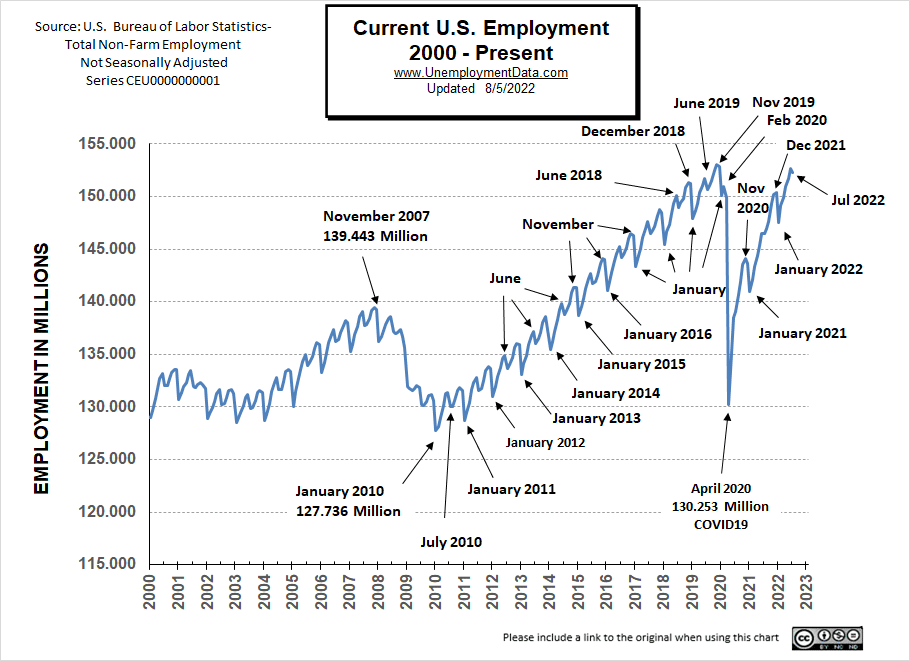
Originally the BLS reported employment of 152.692 million for June which they adjusted this month down to 152.634 million. So, 58,000 jobs disappeared for June. So even if they just reported the same number as they originally did in June we would have a 58,000 job increase!
Now they are reporting 152.249 million jobs for July which is actually a decrease of 443,000 jobs based on their original estimates or a decrease of 385,000 based on their updated numbers. So employment is actually down, unadjusted U6 is UP, Unadjusted U3 is UP, and LFPR is Down, but somehow this is presented as a rosy report.
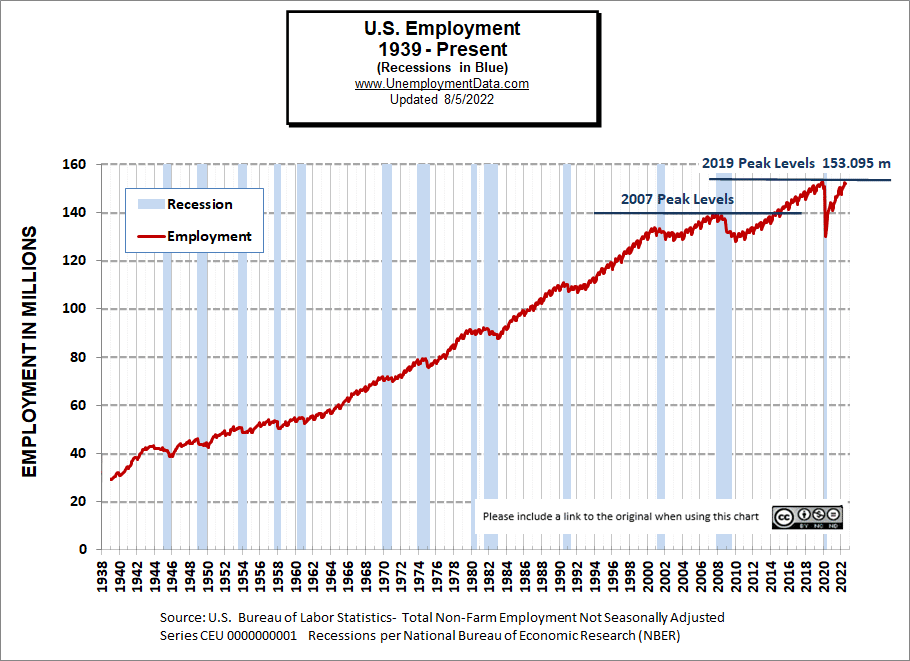
The other factor in their rosy outlook is that employment is now back to pre-covid levels. But when we look at the Establishment Survey numbers we see that February 2020 (pre-covid) at 150.968 million is actually below the November 2019 peak of 153.095 million. So the current 152.249 million is still below the 2019 peak, and that doesn’t even count the roughly 4 million increase in documented population plus the untold millions of new “undocumented” residents.
Historical Employment with Recessions
July 2022 Employment by Sector
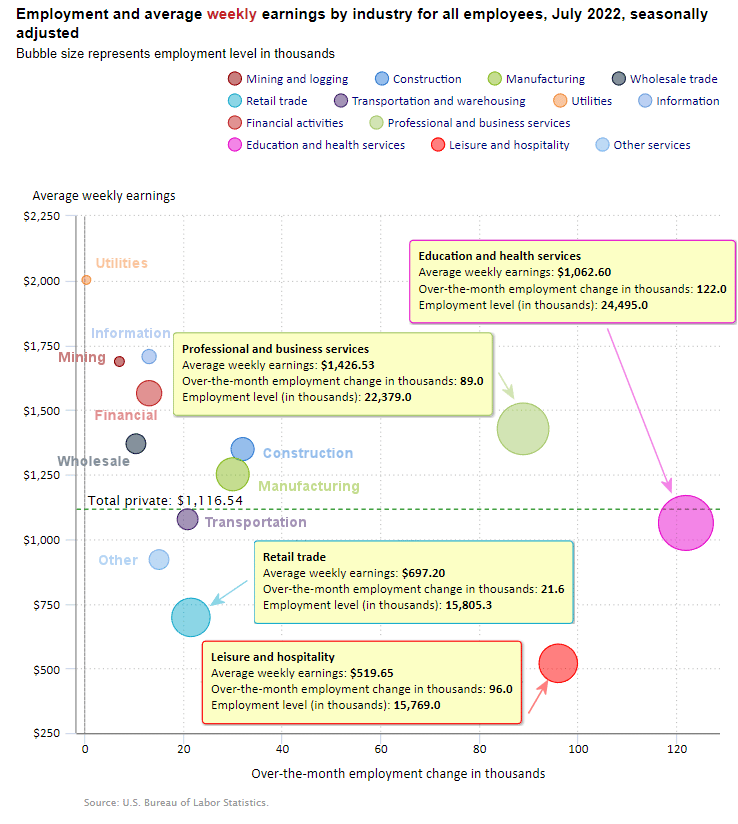
The employment “bubble chart” is a quick and easy way to see how each sector performs on a seasonally adjusted basis. So although we prefer to look at the Establishment Survey numbers these are the household survey adjusted numbers.
The Bubble’s Size tells us the total Employment for that industry (i.e., larger bubbles mean more people are employed in that sector).
The bubble’s location on the chart tells us that there has been a change in Employment Levels over the most recent month… A bubble further to the right indicates larger job growth. A bubble’s vertical location on the chart shows the average industry salary.
The tight Labor Market is still putting upward pressure on wages.
Average Weekly Wages Still Rising
$1,116.54 in July, $1,106.76, in June, $1,105.47 in May and $1,102.01 in April, and $1,086.46 in December 2021.
 Click for a larger image.
Remember, these are Seasonally Adjusted Numbers, so they aren’t cumulative! Every sector gained jobs this month. Education and Health Services was the largest gainer with 122,000 new jobs, Leisure and Hospitality gained with 96,000 new jobs and Professional and Business Services gained 89,000 jobs. This month we’ve added another column that shows the employment levels that the BLS reported last month. Note that although they may claim that there was a “monthly increase” there isn’t always a real increase. Sometimes the increase is due to “seasonal adjusting”. We’ve marked those instances with an asterisk *. On the flip side, sometimes the increase is less than the actual increase due to seasonal adjusting. So, counterintuitively, the “monthly increase” is rarely this month’s employment level minus last month’s employment level.
Employment and Average Weekly Earnings by Industry
July 2022, Seasonally Adjusted Employment
| Industry | Monthly Increase | Average Weekly Earnings | Employment Level July | Employment Level June |
| Total Private Employment | 471,000 | $1,116.54 | 130,254,000 | 129,765,000 |
| Mining and Logging | 7,000 | $1,687.10 | 635,000 | 625,000 |
| Construction | 32,000 | $1,348.30 | 7,706,000 | 7,670,000 |
| Manufacturing | 30,000 | $1,250.78 | 12,826,000 | 12,797,000 |
| Wholesale trade | 10,500 | $1,368.89 | 5,872,200* | 5,874,000 |
| Retail trade | 21,600 | $697.20 | 15,805,300 | 15,777,500 |
| Transportation and Warehousing | 20,900 | $1,076.74 | 6,539,600* | 6,553,800 |
| Utilities | 400 | $2,002.81 | 541,600 | 540,800 |
| Information | 13,000 | $1,706.26 | 3,020,000 | 3,008,000 |
| Financial Activities | 13,000 | $1,564.44 | 8,965,000 | 8,951,000 |
| Professional and Business Services | 89,000 | $1,426.53 | 22,379,000 | 22,273,000 |
| Education and Health Services | 122,000 | $1,062.60 | 24,495,000 | 24,339,000 |
| Leisure and Hospitality | 96,000 | $519.65 | 15,769,000 | 15,665,000 |
| Other Services | 15,000 | $920.92 | 5,700,000 | 5,691,000 |
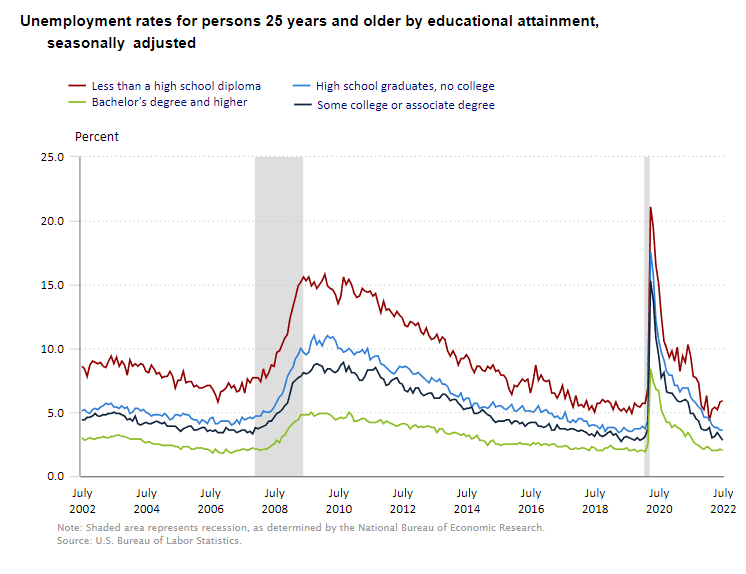
Unemployment by Education
Unemployment among College grads increased slightly to 2.1%, those with some college rose from 3.1% in April to 3.3% in May but fell back to 3.1% in June, while those with less than a High School diploma fell from 5.4% in April to 5.2% in May but rose to 5.8% in June. The upturn in uneducated unemployment could be an early indicator of trouble brewing in the economy.
| Less than H.S. | H.S. No College | Some College | Bachelors + | |
| Feb 2022 | 4.3% | 4.5% | 3.8% | 2.2% |
| Mar 2022 | 5.2% | 4.0% | 3.0% | 2.0% |
| Apr 2022 | 5.4% | 3.8% | 3.1% | 2.0% |
| May 2022 | 5.2% | 3.8% | 3.4% | 2.0% |
| Jun 2022 | 5.8% | 3.6% | 3.1% | 2.1% |
| Jul 2022 | 5.9% | 3.6% | 2.8% | 2.0% |
As we said last month, the weakness is beginning to show in the employment of those with less than a High School diploma. They are the unskilled easily replaced workers (always the first to go) and their unemployment levels are rising. But it hasn’t filtered down to the higher levels of education yet.
Source: BLS
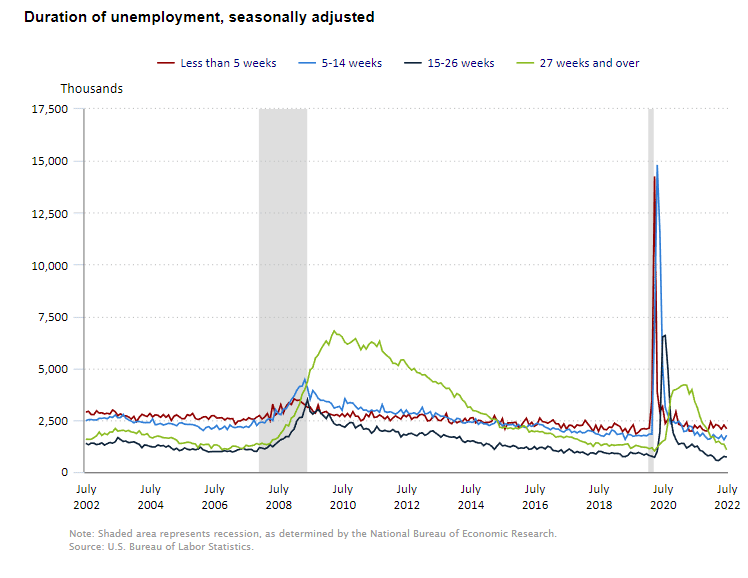
Duration of Unemployment
Unemployment among the newly unemployed, i.e., less than 5 weeks, fell in June, as did the long-term unemployed. Only those jobless for 5-14 weeks rose.
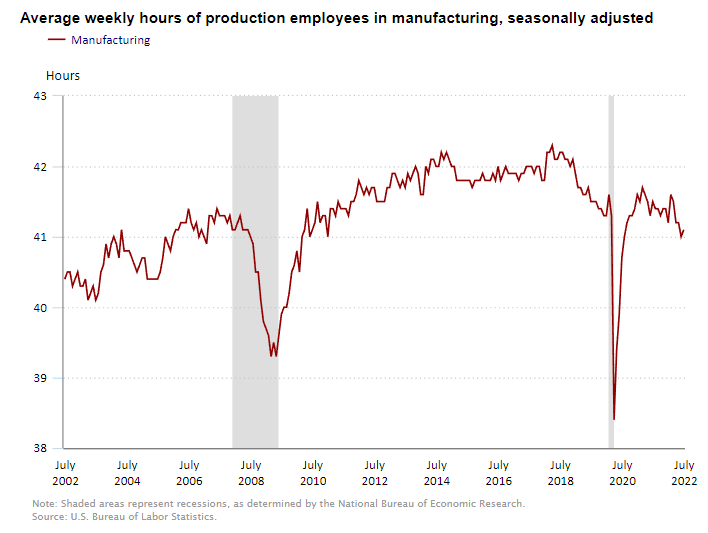
Average Weekly Hours
The average number of hours worked by manufacturing employees had been falling but did rise this month. So after hiring enough employees to drop the hours they may be deciding not to hire new employees and increase hours instead??? Or it could be they can’t find qualified employees… or simply seasonal variations.
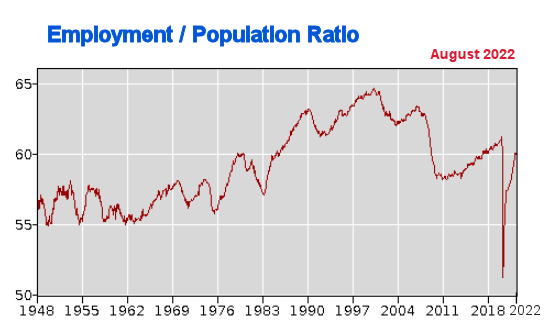
Employment / Population Ratio
As we can see in the Employment-Population Ratio since 1948:
From 1948 through 1976 between 55% and 58.2% of the total population worked outside the home. But in 1977 all that began to change. By the end of 1977, it was at 58.7% and by 1979 it was over 60%.
Those numbers continued to climb for the next two decades and at the turn of the century, the Employment-Population ratio was around 65%. For the next decade, it fell rather steadily (with a brief respite from 2004-2007). So that by 2010 it was back around 58.5%.
Through the teens, it gradually regained a bit of its loss. So by the end of 2019 and the beginning of 2020, the Employment-Population ratio was hovering between 61.0% and 61.2%. So roughly 61% of the population was working… 4% less than in 2000. But then, due to the COVID-19 virus, we saw a sharp drop in March 2020 to 60.0%, and April saw an unprecedented drop to 51.3%.
By July 2020, the Employment-Population ratio had regained roughly half of its loss taking it to 55.1%. Then the Employment / Population ratio rose steadily throughout 2021, so by May 2021, it was 58.0%. It increased slowly until December when it reached 59.5%. Through May 2022, the employment-population ratio only increased another 0.6% to reach 60.1% where it began to falter and by July it was at 60.0%.
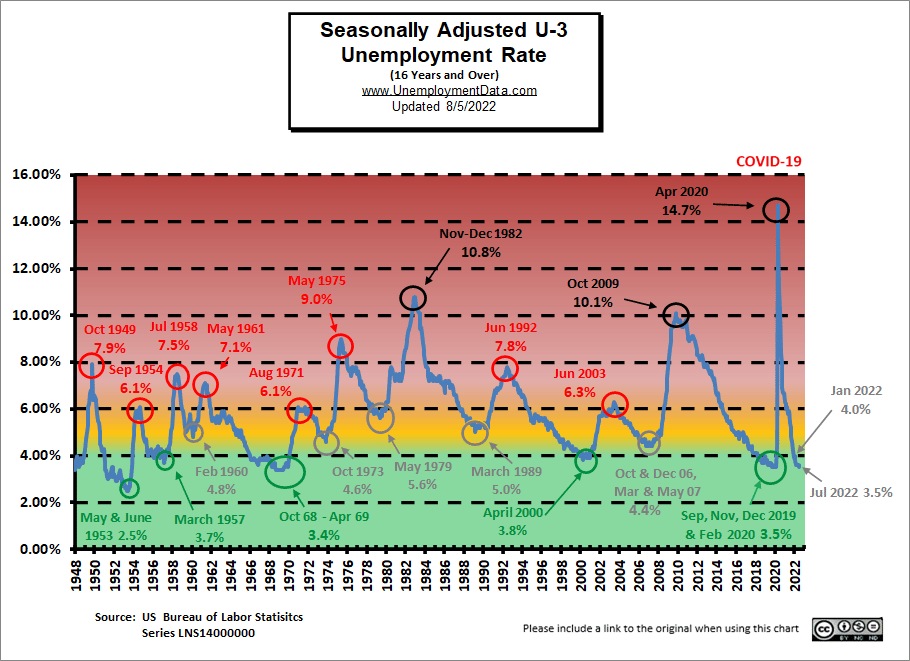
Unemployment Still Historically Low
Unemployment levels are in historically low territory. After all, the FED did pump unprecedented TRILLIONS into the economy to get us to this place.
See: FED Actions for more info.
But we can see that Seasonally Adjusted U-3 is definitely in the “Green” territory.
 Click for a larger Image
July 2022 Labor Force Participation Rate
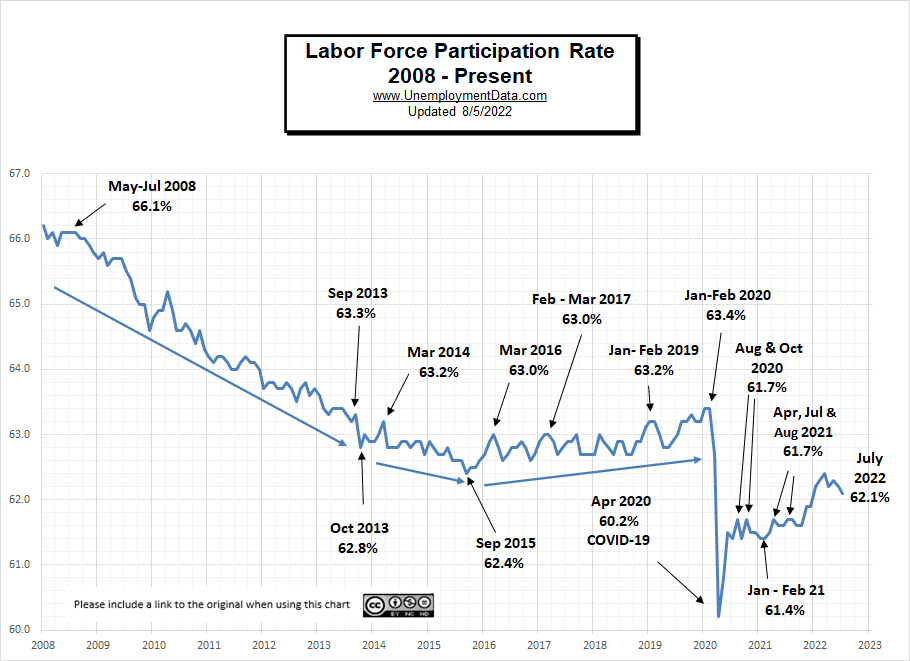 LFPR ticked down 1/10th% in June and another in July after reaching 62.3% in May but is still more than an entire percentage point below Jan-Feb 2020 levels (i.e. 63.4%), possibly indicating a permanent departure from the labor force by one spouse in order to be more active in their children’s lives and education.
See Labor Force Participation Rate for more information.
Seasonally Adjusted U1 through U6 Unemployment Rates
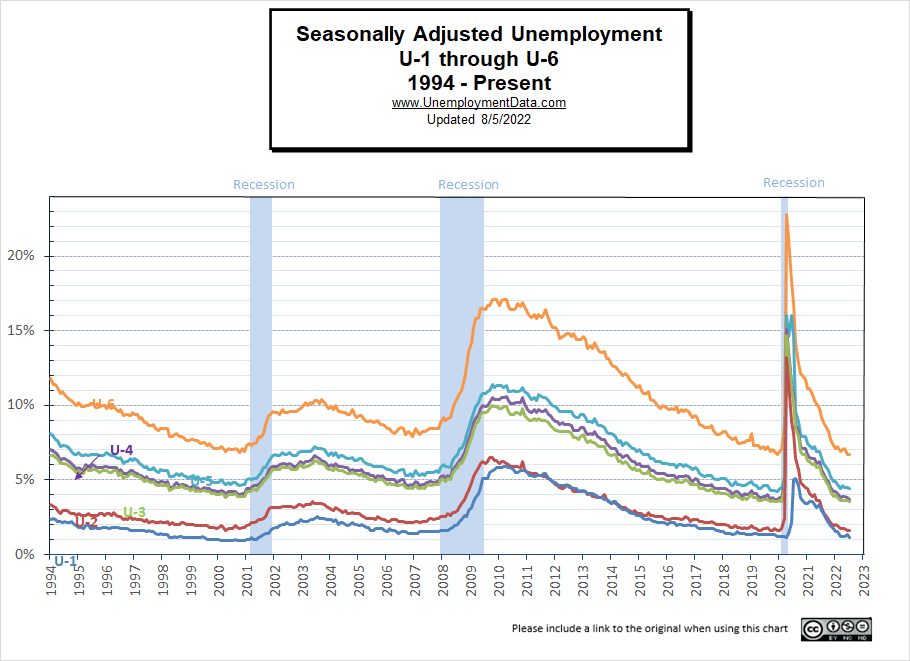
For more information about the various measurements of unemployment, see What Is U-6 Unemployment?
ADP National Employment Report
In addition to the BLS, we can look at the Jobs Report generated by private companies like ADP Research Institute. Unfortunately, ADP has announced a pause to their reporting.
“ADP Research Institute (ADPRI) and the Stanford Digital Economy Lab (the “Lab”) announced they will retool the ADP National Employment Report (NER) methodology to provide a more robust, high-frequency view of the labor market and trajectory of economic growth. In preparation for the changeover to the new report and methodology, ADPRI will pause issuing the current report and has targeted August 31, 2022, to reintroduce the ADP National Employment Report in collaboration with the Stanford Digital Economy Lab (the “Lab”). We look forward to providing an even more comprehensive labor market analysis and will be in touch with additional details closer to the re-launch, later this summer. For more information on this announcement, please visit here.”
Click here if you would like to receive this monthly report and other article updates. You can unsubscribe at any time.
Here are some articles you might enjoy in case you missed them:
Read more on UnemploymentData.com.
- Is the Average Worker “Falling Behind”?
- 4 Ways to Keep Good Employees at Your Company for Longer
- June 2022 BLS Jobs Report- Recession Indicators?
From InflationData.com
- The Many Evils of Inflation
- July 4th Cookout Will Cost You 17% More in 2022
- Surprise, Surprise, The FED Raises Rates by .75%
- Inflation Takes a Bite Out of Your Food Budget
- Inflation Adjusted Gasoline Hits New High
- Worldwide Inflation by Country 2022
From Financial Trend Forecaster
- Moore Inflation Predictor
- NYSE ROC
- NASDAQ ROC
- How Low Can the S&P 500 Go?
- France’s War on Terror Uses Eagles to Catch Drones
- The Fed’s New “Tightening” Plan Is Too Little, Too Late
- Keynesians and Market Monetarists Didn’t See Inflation Coming
- What the “Housing Busts” Indicator Is Saying Now
- How to Prepare for a Hard-Hitting Bear Market (Think 1929-1932)
- The Dow 8 Waves are Incomplete
- What to Make of the Stock Market’s Bounce
- Is the Correction Over Yet?
From OptioMoney.com
- How Addiction Can Cause Financial Trouble
- Common Mistakes to Avoid When Investing in Real Estate
- Financial Mistakes to Avoid After College
- Common Tax Mistakes That You Need To Avoid
- 6 Passive Income Ideas to Grow Your Wealth
From Your Family Finances