
![]() Correction: The differential was only 3.5% in August 2018 and 3.2% in September 2006 so we are only nearing the 2006 level not at the 2006 level.
Correction: The differential was only 3.5% in August 2018 and 3.2% in September 2006 so we are only nearing the 2006 level not at the 2006 level.
The U.S. Bureau of Labor Statistics (BLS) released their monthly employment survey results for the month of August on September 7th .
The current “Seasonally Adjusted” Unemployment Rate for August (released September 7th) is 3.9% unchanged from last month.
Looking back, Seasonally Adjusted U-3 started 2017 at 4.8% then it bounced around between 4.3% and 4.4% from April through October 2017, then it was 4.1% from October 2017 through March 2018. It was 3.9% in April, 3.8% in May, 4.0% in June, and 3.9% in July.
Typically Unemployment levels are worse in June and July so seasonally adjusting takes that into consideration.
|
Unadjusted |
Unadjusted U-3 |
|
| 2017 | 2018 | |
| May | 4.1% | 3.6% |
| June | 4.5% | 4.2% |
| July | 4.6% | 4.1% |
| August | 4.5% | 3.9% |
Key August Employment and Unemployment Numbers
- Adjusted U-3 Unemployment- 3.9% unchanged from July, down from 4.0% in June but above the 3.8% in May, it was 3.9% in April but still Below the 4.1% October 2017 – March 2018.
- Unadjusted U-3 Unemployment- 3.9% down from 4.1% in July and 4.2% in June but still above the 3.6% in May, and 3.7% in April below the 4.1% in March.
- Unadjusted U-6 Unemployment- 7.4% down from 7.9% in July, 8.1% in June, up slightly from record lows of 7.3% in May, and 7.4% in April. Below the 8.1% in March and 8.6% in February.
- Employment 149.226 million up from 148.901 million in July.
- August Labor Force Participation Rate 62.7% down from July LFPR 62.9%
See Current Unemployment Chart for more info.
Full Employment is Near – Differential between U3 and U6 reaches September 2006 Lows
In August we saw a massive drop in the differential between U-3 and U-6 so perhaps we are getting closer to “full employment” the lows on this chart are at 2.7% in October 2000 and 3.2% in September 2006. Since the current differential is once again 3.2% we have reached the lows of 2006. Back in January 2017 the media was saying that we were at “Full Employment” and we couldn’t expect anything better, manufacturing jobs would never come back etc. At that time I said we had a long way to go and that the differential between the U-6 and U-3 was nowhere near bottoming (the sign of full employment) at the time the differential was around 5%. See: Is the U.S. Really at “Full Employment”? But with the differential currently at 3.2% now we are at or very near that level. Since October 2000 reached a low of 2.7% we could still go a bit lower.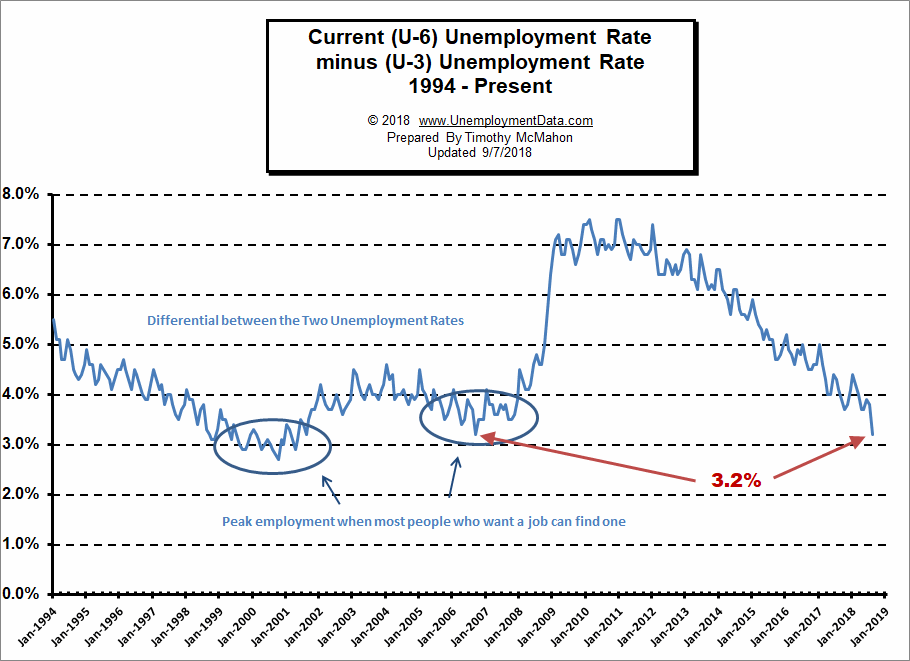
See Current U-6 Unemployment Rate for more info.
Employment by Sector
The employment “bubble chart” gives us a good representation of how each sector of the economy is doing (employment wise). As we can see from the chart below several sectors are to the left of the zero line this month indicating that they lost employees. Interestingly Mining and Logging, Financial Activities, and Transportation lost employees last month but gained them back this month. The big gainers this month were Education and Health Services +53,000, Professional and business Services +53,000 (after gaining +51,000 last month) and Leisure and Hospitality +17,000 (after gaining +40,000 last month). Losers were Manufacturing after gaining +37,000 last month they lost -3,000 this month, Retail which lost -5,900 this month, Information which lost -6,000 and Utilities which was virtually unchanged.
Average weekly wages increased sharply from $933.23 to $937.02 for an annualized increase of 4.87%.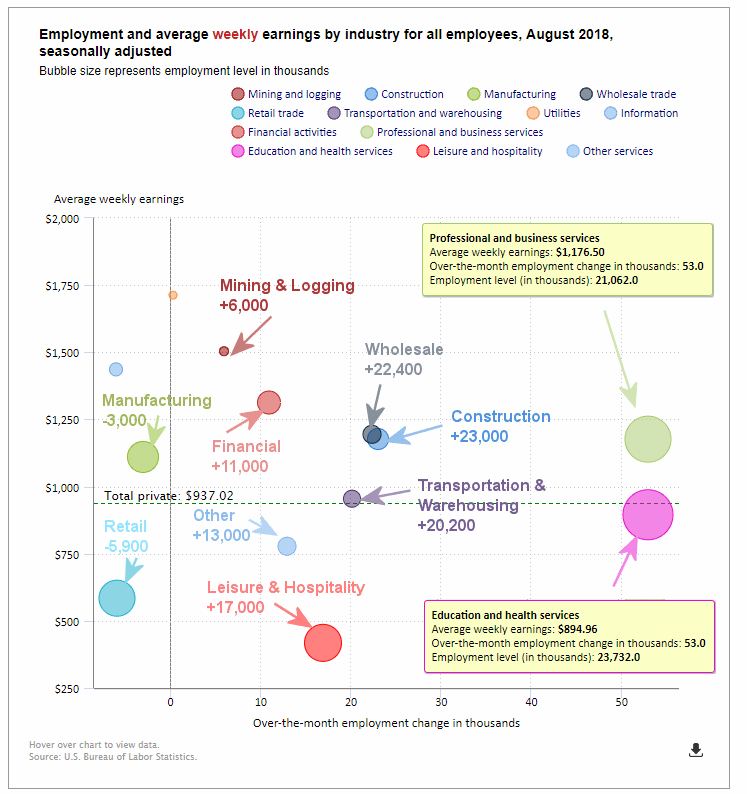
(See the table below for average weekly earnings and other details.)
How to read this chart:
Bubbles location on the chart tell us two things:
- Change in Employment Levels over the most recent month.
- Average Weekly earnings.
- The further to the right the bubble the larger the increase in the number of jobs.
- The higher up on the chart the larger the average salary.
Bubble Size tells us:
- Total Employment for the sector.
- Larger bubbles mean more people are employed in that sector.
Employment and Average Weekly Earnings by Industry for All Employees
August 2018, Seasonally Adjusted
| Industry | Monthly Increase | Average Weekly Earnings | Employment Level |
| Total Private Employment | 204,000 | $937.02 | 126,939,000 |
| Mining and Logging | 6,000 | $1,503.81 | 746,000 |
| Construction | 23,000 | $1,177.04 | 7,259,000 |
| Manufacturing | -3,000 | $1,110.28 | 12,717,000 |
| Wholesale trade | 22,400 | $1,194.57 | 6,007,100 |
| Retail trade | -5,900 | $584.35 | 15,913,500 |
| Transportation and Warehousing | 20,000 | $954.72 | 5,349,000 |
| Utilities | -300 | $1,712.63 | 550,500 |
| Information | -6,000 | $1,436.42 | 2,762,000 |
| Financial Activities | 11,000 | $1,312.99 | 8,588,000 |
| Professional and Business Services | 53,000 | $1,176.50 | 21,062,000 |
| Education and Health Services | 53,000 | $894.96 | 23,732,000 |
| Leisure and Hospitality | 17,000 | $418.12 | 16,374,000 |
| Other Services | 13,000 | $777.72 | 5,879,000 |
U-6 Unemployment
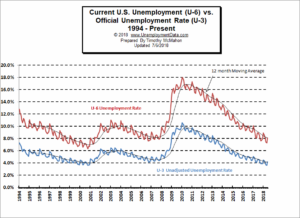
For August 2018 the official Current U-6 unemployment rate was 7.4% down from 7.9% in July which was down from 8.1% in June but still above the low of 7.3% in May and equal to the 7.4% in April. This is well below the range of 8.1% in March, 8.6% in February, 8.0% in December 2017.
U-6 Unemployment was 10.1% in January 2017 with a long term peak at 17.9% in February 2010.
See Unadjusted U-6 unemployment for more info.
Employment
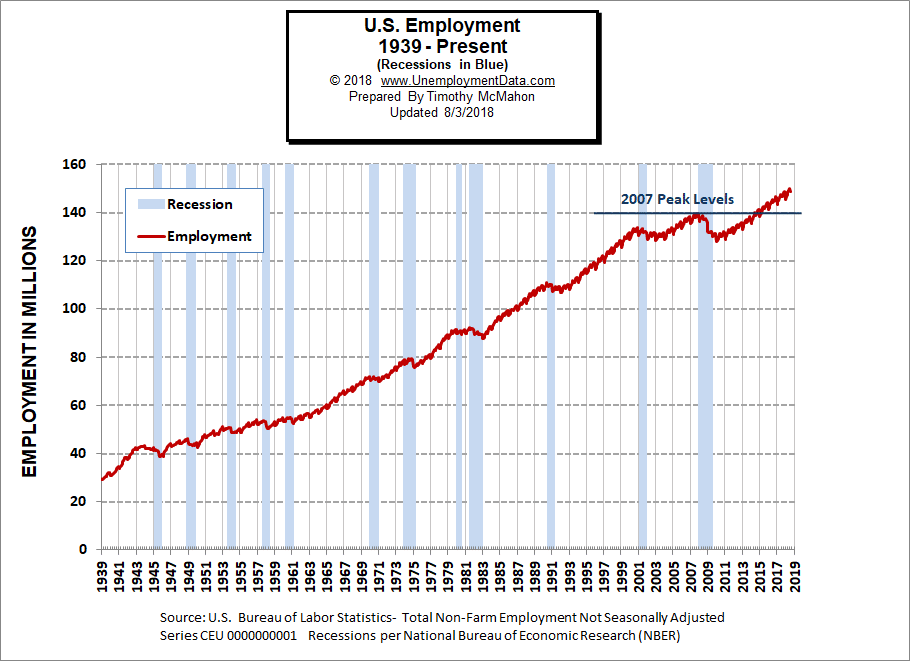 According to the BLS Commissioner’s report for this month: “Total nonfarm payroll employment increased by 201,000 in August, and the unemployment rate was unchanged at 3.9 percent. Job gains occurred in professional and business services, health care, wholesale trade, transportation and warehousing, and mining….”
The 201,000 jobs the commissioner is talking about are “Seasonally Adjusted” jobs. If we look at the actual jobs we see that July had 148.892 million jobs and August had 149.229 million jobs for a net increase of 334,000 jobs.
Labor Force Participation Rate
The LFPR for August was 62.7% down from 62.9% in in July.
Originally, the BLS reported that the June LFPR jumped dramatically to 63.4% exceeding 63.2% for the first time since 2014. But last month they changed it saying it was only 62.9% the same as July 2017 and July 2018. The LFPR for August and May was 62.7%, and in April it was 62.8%, March was 62.9%, February was 63.0%. (Higher is better so a falling LFPR is not good).
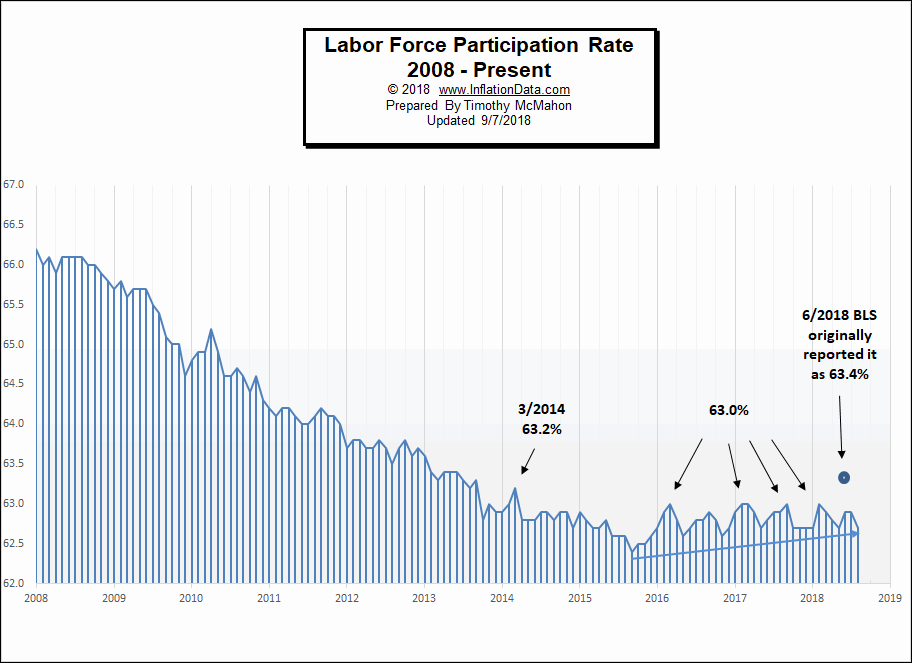
See Labor Force Participation Rate for more information.
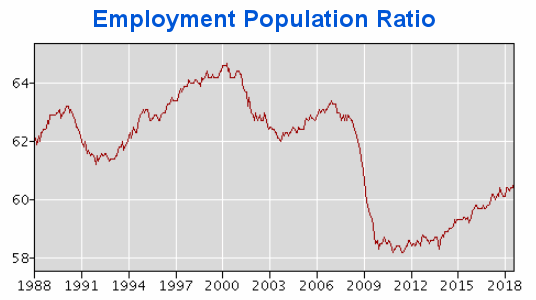
Employment Population Ratio
The index many people think of when they hear the term Labor Force Participation Rate might be closer described by the Employment Population Ratio. This index shows the percentage of the entire population that is working. In many ways it is a better index than the LFPR or the Unemployment rate.
- Here are some articles you might enjoy in case you missed them:Read more on UnemploymentData.com.
- Start Your New Career Right
- 4 Effective Ways to Promote Your Business
- Careers for Animal Lovers
- Unemployment Rates by State July 2018
- Sports Management and Other Non-Athletic Sports Careers
From InflationData.com
- Can Crypto Solve Venezuela’s Hyperinflation Problem?
- Cost of Living: LA and New York vs. The World
- July Inflation Up a Fraction
- Annual Inflation Up Slightly in June
- What Impact (if any) Does Disruption have on Inflation?
- Debt and Inflationary Pressures: A Lesson in Economic Interactivity
- What Impact (if any) Does Disruption have on Inflation?
- Inflation Risk
From Financial Trend Forecaster
- Technological Solution to 100 Year Old Oil Problem
- Oil Price War: Saudi Arabia vs. Iran
- Coke, Meth And Booze: The Dark Side Of The Permian Oil Boom
- Why Graphene Hasn’t Taken Over the World- Yet
- New Oil Cartel Threatening OPEC
- 3 Breakthrough Technologies Changing The Energy Sector
- Can Saudi Arabia Prevent The Next Oil Shock?
- IEA: High Oil Prices “Taking A Toll” On Demand
- Don’t Count Your North Korean Chickens Before They’re Hatched
- When Will Electric Cars Take Over The Roads?
From Elliott Wave University
- This Doesn’t Happen in Bear Markets
- Is Gold on the Verge of a Bottom?
- Moving Averages Help You Define Trend – Here’s How
- Charts Say Stocks Could Rise For 10-15 Years
- Latest Economic Data Doesn’t Align with Yield Curve Fears
From OptioMoney.com
- When is the Right Time to Buy Life Insurance?
- 4 Things Home Buyers Shouldn’t Do During the Mortgage Process
- Tips for Avoiding Cash Crunches and Managing Cash Flow in Business
- How to Survive Bankruptcy
- How to Lower the Chances of Bankruptcy as a Personal Business Owner
From Your Family Finances