The U.S. Bureau of Labor Statistics (BLS) released their monthly unemployment survey results for February on March 8th and it has the market pundits wringing their hands over the mere 20,000 jobs created after projections were for 175,000 jobs. Optimists are blaming the government shutdown combined with the weather causing a lack of construction jobs in the Seasonally Adjusted jobs numbers.
But if job creation is only 20,000 why is Unadjusted U-6 Unemployment down from 8.8% in January to 7.7% in February? Why has the unemployment rate for Hispanics dropped to another mega low of 4.3%? And why is the unemployment rate for Women 3.6%?
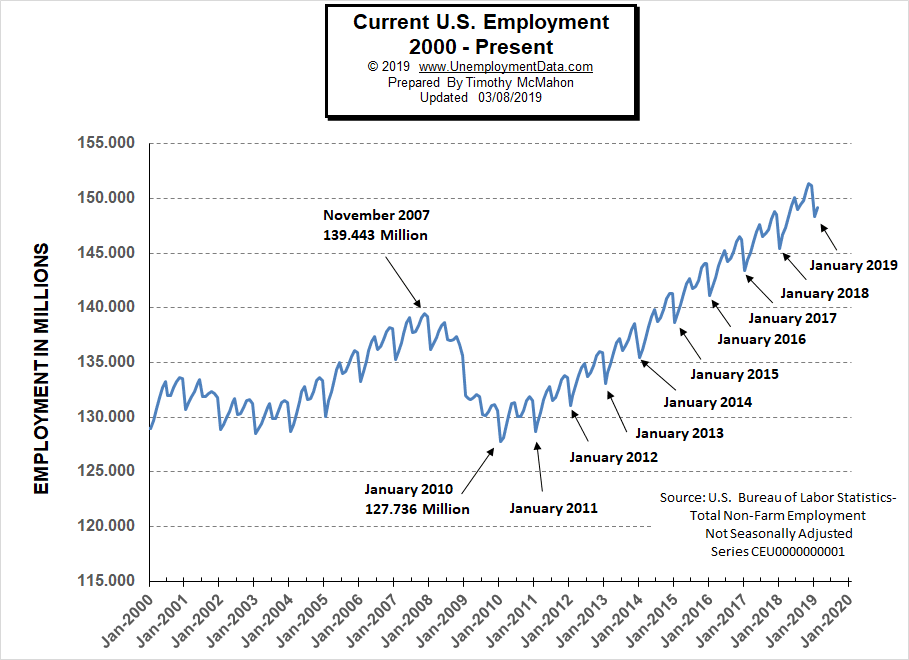
The non-seasonally adjusted jobs number is up by 827,000 jobs from January to February compared to an increase of 1.237 million during the same period last year and an increase of 1.03 million from January – February 2017. So, yes the increase is considerably smaller but as we near full employment it becomes progressively harder to find new employees even if you have jobs available. The problem shifts from a lack of jobs to a lack of qualified employees.
Key February Employment and Unemployment Numbers
- Adjusted U-3 Unemployment- 3.8% down from 4.0% in January, 3.9% in December and 3.7% in November.
- Unadjusted U-3 Unemployment- 4.1% down from 4.4% in January, 3.7% in December and 3.5% in November.
- Unadjusted U-6 Unemployment- 7.7% down from 8.8% in January, 7.5% in December and 7.2% in November.
- Unadjusted Employment (Establishment Survey)- 149.133 up from 148.201 million in January, 151.190 million in December and 151.244 million in November.
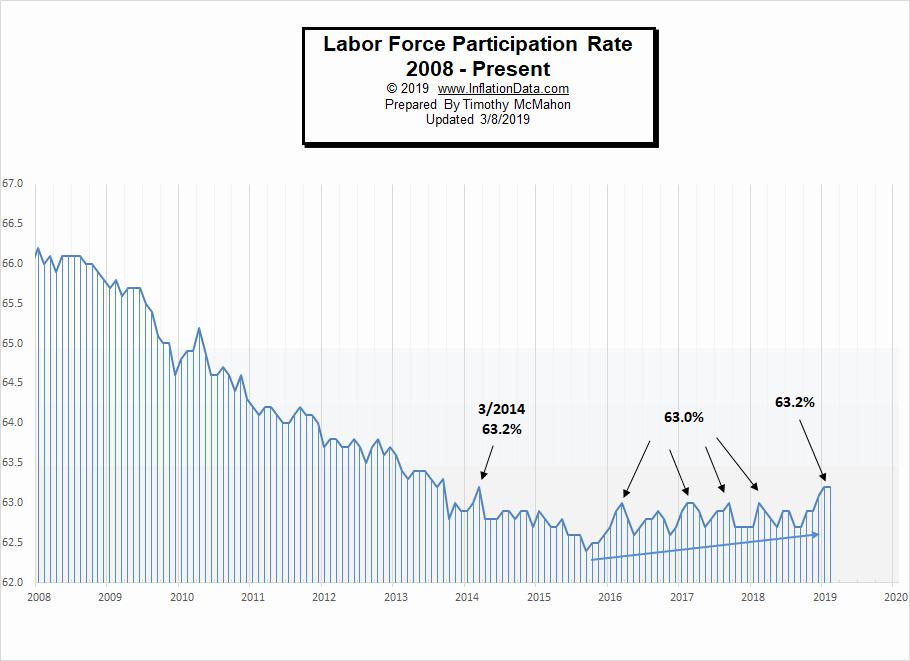
- February Labor Force Participation Rate- Unchanged at 63.2% up from 63.1% in December and LFPR 62.9% highest since 2013.
- 101st straight gain in Seasonally Adjusted Employment- (Household Survey) 156.949 up from 156.694 in January
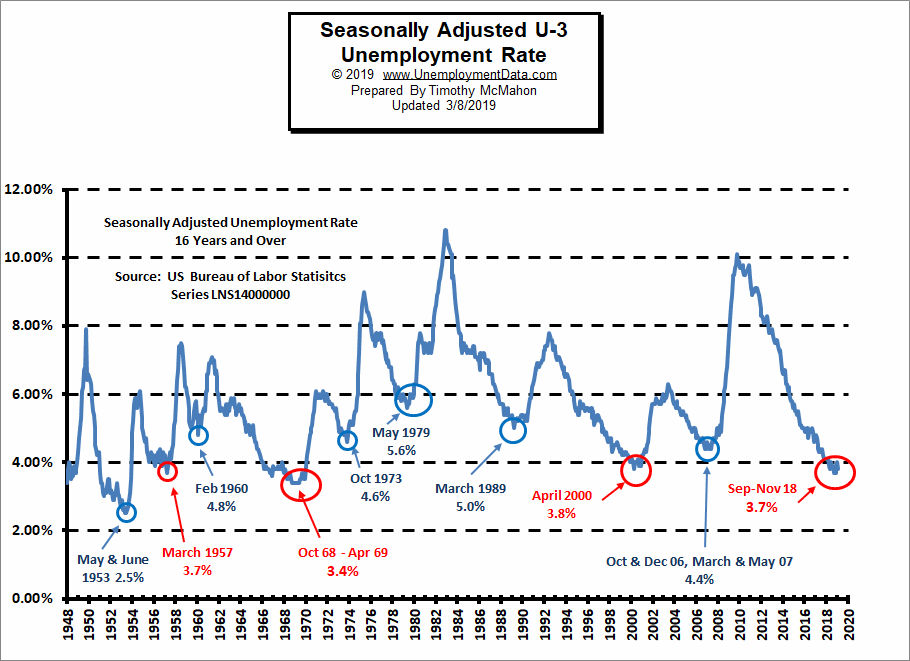
Current Seasonally Adjusted U-3 levels are hovering around the lows of 2000. Prior to that we have to go all the way back to 1969 to see better unemployment levels than we have currently. Current levels are rising a bit from a cyclical low not seen since 1969. Also noteworthy is that levels do not stay this low for very long. The longest low like this was the seven month period from October 1968 through April 1969. Prior to 1969 was a one month low of 3.7% in 1957. On the plus side, the current drop from 4.0% back to 3.8% brings us very close to the 3.7% lows of September-November 2018.
See Current Unemployment Chart for more info.
Previous Record Low Unemployment (Seasonally Adjusted U-3)
(4% or below in Blue)
| Jan | Feb | Mar | Apr | May | Jun | Jul | Aug | Sep | Oct | Nov | Dec | |
| 1950 | 6.5% | 6.4% | 6.3% | 5.8% | 5.5% | 5.4% | 5.0% | 4.5% | 4.4% | 4.2% | 4.2% | 4.3% |
| 1951 | 3.7% | 3.4% | 3.4% | 3.1% | 3.0% | 3.2% | 3.1% | 3.1% | 3.3% | 3.5% | 3.5% | 3.1% |
| 1952 | 3.2% | 3.1% | 2.9% | 2.9% | 3.0% | 3.0% | 3.2% | 3.4% | 3.1% | 3.0% | 2.8% | 2.7% |
| 1953 | 2.9% | 2.6% | 2.6% | 2.7% | 2.5% | 2.5% | 2.6% | 2.7% | 2.9% | 3.1% | 3.5% | 4.5% |
| 1954 | 4.9% | 5.2% | 5.7% | 5.9% | 5.9% | 5.6% | 5.8% | 6.0% | 6.1% | 5.7% | 5.3% | 5.0% |
| 1955 | 4.9% | 4.7% | 4.6% | 4.7% | 4.3% | 4.2% | 4.0% | 4.2% | 4.1% | 4.3% | 4.2% | 4.2% |
| 1956 | 4.0% | 3.9% | 4.2% | 4.0% | 4.3% | 4.3% | 4.4% | 4.1% | 3.9% | 3.9% | 4.3% | 4.2% |
| 1957 | 4.2% | 3.9% | 3.7% | 3.9% | 4.1% | 4.3% | 4.2% | 4.1% | 4.4% | 4.5% | 5.1% | 5.2% |
| 1958 | 5.8% | 6.4% | 6.7% | 7.4% | 7.4% | 7.3% | 7.5% | 7.4% | 7.1% | 6.7% | 6.2% | 6.2% |
| … | … | … | … | … | … | … | … | … | … | … | … | … |
| 1965 | 4.9% | 5.1% | 4.7% | 4.8% | 4.6% | 4.6% | 4.4% | 4.4% | 4.3% | 4.2% | 4.1% | 4.0% |
| 1966 | 4.0% | 3.8% | 3.8% | 3.8% | 3.9% | 3.8% | 3.8% | 3.8% | 3.7% | 3.7% | 3.6% | 3.8% |
| 1967 | 3.9% | 3.8% | 3.8% | 3.8% | 3.8% | 3.9% | 3.8% | 3.8% | 3.8% | 4.0% | 3.9% | 3.8% |
| 1968 | 3.7% | 3.8% | 3.7% | 3.5% | 3.5% | 3.7% | 3.7% | 3.5% | 3.4% | 3.4% | 3.4% | 3.4% |
| 1969 | 3.4% | 3.4% | 3.4% | 3.4% | 3.4% | 3.5% | 3.5% | 3.5% | 3.7% | 3.7% | 3.5% | 3.5% |
| 1970 | 3.9% | 4.2% | 4.4% | 4.6% | 4.8% | 4.9% | 5.0% | 5.1% | 5.4% | 5.5% | 5.9% | 6.1% |
| … | … | … | … | … | … | … | … | … | … | … | … | … |
| 1999 | 4.3% | 4.4% | 4.2% | 4.3% | 4.2% | 4.3% | 4.3% | 4.2% | 4.2% | 4.1% | 4.1% | 4.0% |
| 2000 | 4.0% | 4.1% | 4.0% | 3.8% | 4.0% | 4.0% | 4.0% | 4.1% | 3.9% | 3.9% | 3.9% | 3.9% |
| 2001 | 4.2% | 4.2% | 4.3% | 4.4% | 4.3% | 4.5% | 4.6% | 4.9% | 5.0% | 5.3% | 5.5% | 5.7% |
| … | … | … | … | … | … | … | … | … | … | … | … | … |
| 2018 | 4.1% | 4.1% | 4.1% | 3.9% | 3.8% | 4.0% | 3.9% | 3.9% | 3.7% | 3.7% | 3.7% | 3.9% |
| 2019 | 4.0% | 3.8% |
Employment
According to the BLS Commissioner’s report for this month:
“The unemployment rate declined by 0.2 percentage point to 3.8 percent in February, and the number of unemployed persons decreased by 300,000 to 6.2 million. Among the unemployed, the number of job losers and persons who completed temporary jobs (including people on temporary layoff) declined by 225,000. This decline reflects, in part, the return of federal workers who were furloughed in January due to the partial government shutdown.”
Key factors in the report were the unemployment rate for Hispanics dropped to another mega low of 4.3% and the unemployment rate for Women was 3.6% . The Seasonally Adjusted U-6 dropped to 7.3% the lowest rate since March 2001. Although the Commissioner’s report glossed over it, the LFPR remains at its highest level since 2013… which is very good news.
See Current Employment for more info.
Employment by Sector
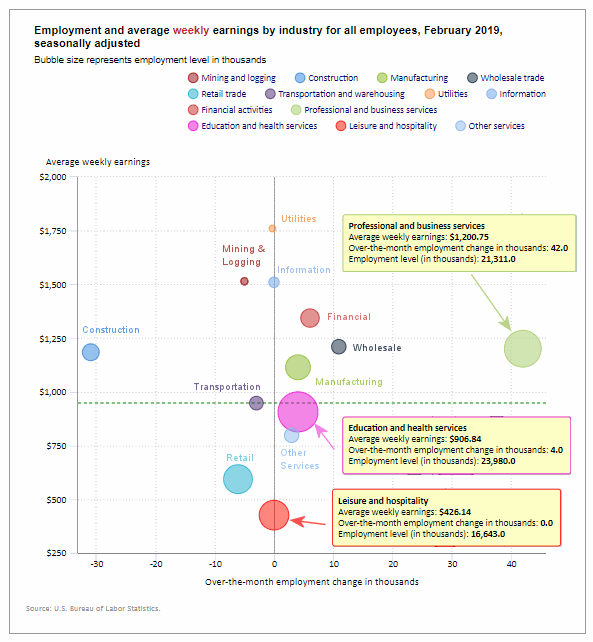
The employment “bubble chart” gives us a good representation of how each sector of the economy is doing (employment wise). As we can see from the chart below the zero line this month in almost in the middle of the chart with several sectors losing employees this month. The biggest loser (as alluded to above) is construction with a loss of -31,000 jobs (possibly due to bad weather). Other losers are Mining and Logging -5,000, Retail -6,100, Transportation and Warehousing -3,000, and Utilities -300.
The biggest gainer (furthest to the right on the chart) was Professional and Business Services adding 42,000 jobs this is a moderately paid sector earning $1200.75 on average per week very similar to the construction industry with an average weekly earning of $1184.51. Manufacturing jobs continue to increase (up 4,000 this month).
Average weekly wages continued to rise from $940.84 in November to $950.82 in January to $951.50 in February.
(See the table below for average weekly earnings and other details.)
How to read this chart:
Bubbles location on the chart tell us two things:
- Change in Employment Levels over the most recent month.
- Average Weekly earnings.
- The further to the right the bubble the larger the increase in the number of jobs.
- The higher up on the chart the larger the average salary.
Bubble Size tells us:
- Total Employment for the sector.
- Larger bubbles mean more people are employed in that sector.
Employment and Average Weekly Earnings by Industry
February 2019, Seasonally Adjusted
| Industry | Monthly Increase | Average Weekly Earnings | Employment Level |
| Total Private Employment | 25,000 | $951.50 | 128,123,000 |
| Mining and Logging | -5,000 | $1,514.85 | 754,000 |
| Construction | -31,000 | $1,184.51 | 7,422,000 |
| Manufacturing | 4,000 | $1,114.37 | 12,834,000 |
| Wholesale trade | 10,900 | $1,210.17 | 5,922,200 |
| Retail trade | -6,100 | $593.64 | 15,828,600 |
| Transportation and Warehousing | -3,000 | $947.63 | 5,537,600 |
| Utilities | -300 | $1,760.35 | 555,400 |
| Information | 0 | $1,509.90 | 2,815,000 |
| Financial Activities | 6,000 | $1,343.41 | 8,630,000 |
| Professional and Business Services | 42,000 | $1,200.75 | 21,311,000 |
| Education and Health Services | 4,000 | $906.84 | 23,980,000 |
| Leisure and Hospitality | 0 | $426.14 | 16,643,000 |
| Other Services | 3,000 | $797.50 | 5,890,000 |
The Differential between U3 and U6
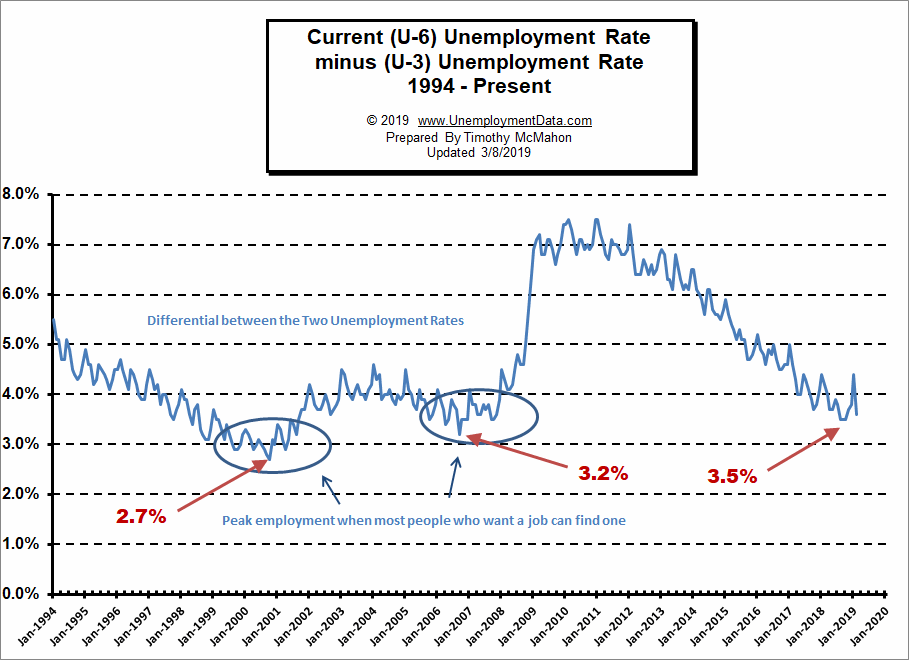
For the last several months the differential between the unadjusted U3 and U6 (reached by subtracting U3 from U6) was at 3.5% but over the last couple of months it jumped up culminating in a 4.4% differential in January. But in February it fell back to 3.6%.
See Current U-6 Unemployment Rate for more info.
U-6 Unemployment
 Current U-6 Unadjusted Unemployment Rate for February is 7.7%
January 2019 was: 8.8% and it was 7.5% in December 2018
See Unadjusted U-6 unemployment for more info.
Employment
According to the BLS Commissioner’s report for this month:
“Nonfarm payroll employment changed little in February (+20,000), and the unemployment rate decreased to 3.8 percent. Employment continued to trend up in professional and business services, health care, and wholesale trade but declined in construction. Incorporating revisions for December and January, which increased nonfarm payroll employment by 12,000, monthly job gains averaged 186,000 over the past 3 months.”
Note: These are Seasonally adjusted numbers. Actual employment for February increased by 827,000 after falling by 2.98 million in January. Final employment numbers for December were 151.203 million. January Employment was 148.306 million and February’s preliminary employment numbers are 149.133 million. But the Commissioner is saying that it rose 20,000 more than average for the month of February.
Labor Force Participation Rate
The Labor Force Participation Rate (LFPR) for February was the major bright spot for the Jobs report. In January the LFPR climbed back to 63.2% for the first time since 2014. (Higher is better) and remained there in February. A falling LFPR makes unemployment numbers look better than they actually are because people are dropping out of the labor force so they are no longer counted as “unemployed”. A climbing LFPR means people are re-entering the Labor Force (so they are more optimistic) but they are temporarily unemployed until they find a job making the unemployment numbers look worse than they actually are.
See Labor Force Participation Rate for more information.
Employment Population Ratio
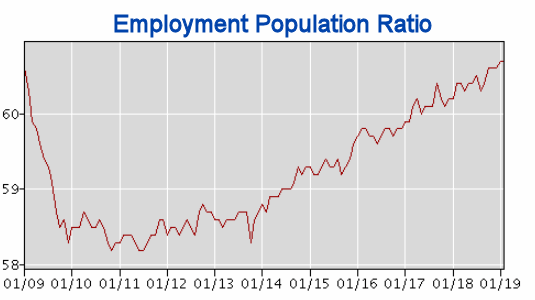
The index many people think of when they hear the term Labor Force Participation Rate might be better described by the Employment Population Ratio. This index shows the percentage of the entire population that is working. In many ways it is a better index than the LFPR or the Unemployment rate. Current levels are back in the range of where they were in 2009 even though the population has drastically increased.
Here are some articles you might enjoy in case you missed them:
Read more on UnemploymentData.com.
- 3 Options to Consider When You Can’t Go Back to Work
- Running a Successful Restaurant Business
- Mowing Grass to Earn Green: Things to Consider Before Starting a Lawn Care Business
- Need Employment? 4 Jobs that are Always Hiring
- Bring Ideas to Life! 3 Tips for Entrepreneurs
From InflationData.com
- Health Insurance Inflation Over the Last 10 Years
- Are Deflationary Forces Taking Hold Again?
- Gold as an Investment
- 2018 Ends with More Disinflation
- How Inflation and Interest Rates Relate
From Financial Trend Forecaster
- Will EV’s Cause Peak Oil Demand?
- Saudi Arabia: We’ll Pump The World’s Very Last Barrel Of Oil
- Renewable Energy Trends in 2019
- Huge Backlog Could Trigger New Wave Of Shale Oil
- Move Aside Lithium – Vanadium Is The New Super-Metal
- U.S. Shale Has A Glaring Problem
- How Free is Your State?
- Traders Should Stay Optimistically Cautious
- Has the FED Hit the Launch Button for the Stock Market?
- How to Build Consistent Trading Success
- Reversals And Counter-trend Moves Typically Take Time To Develop
- Interest Rates Win Again as Fed Follows Market
- Watch This Indicator for Approaching Volatility
From OptioMoney.com
- What’s it Worth? 4 DIY Ways to Increase Value of and Help Sell Your Home
- Medical Equipment Costs: How to Deal with Abrupt Healthcare Expenses
- Home Repairs You Should Think about Saving up For
- How to Teach Your Children to Save Money from a Young Age
- Money-Saving Upgrades: 3 Home Investments to Help Your Wallet
- Want to Boost Your FICO Score? 4 Easy Steps to Help Make That Happen
- Big Family Getting Expensive? 4 Ways to Stay in the Green
From Your Family Finances
- Time for a Change? 5 Tips for Home Renovating on a Budget
- Think Ahead: 4 Steps You Can Take Now to Prevent Expensive Home Repairs Later
- Recovering from the Unexpected: 4 Tips for Financially Dealing with a Medical Condition
- Make Extra Money while Going to College
- 4 Ways You Can Reduce Healthcare Expenses

 Current U-6 Unadjusted Unemployment Rate for February is 7.7%