
![]() The U.S. Bureau of Labor Statistics (BLS) released its employment / unemployment report for December on January 10th.
The U.S. Bureau of Labor Statistics (BLS) released its employment / unemployment report for December on January 10th.
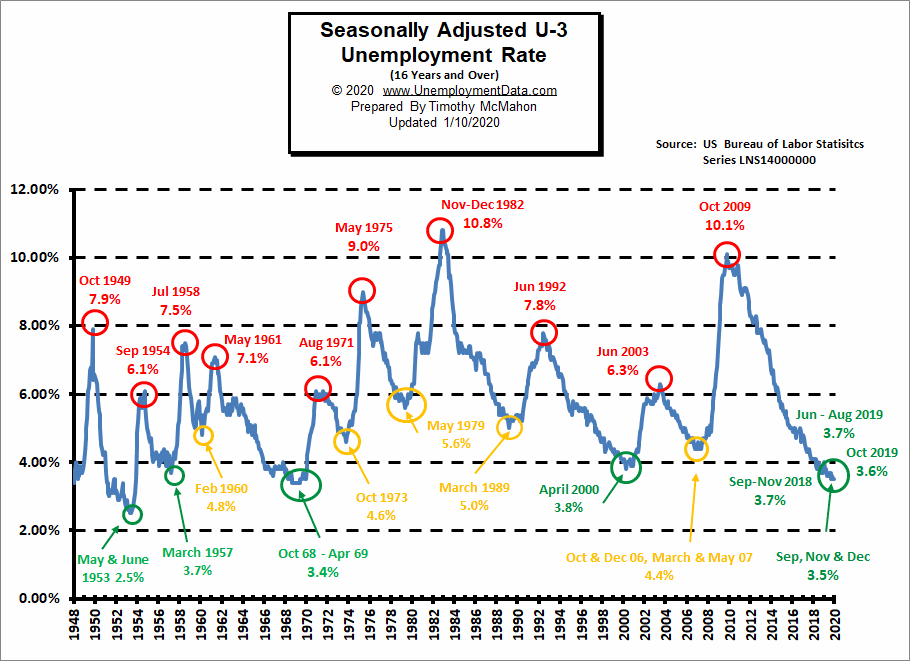
CNBC was quick to label it “disappointing” but at 1/10th of a percent off a 50 year low how disappointing can it really be? The unadjusted numbers were up slightly but that isn’t unusual for December and they weren’t even up by as much as they were last year. In December 2018 the unadjusted U-6 went from 7.2% to 7.5% (i.e. 0.3%). This year it went from 6.5% to 6.7% (up 0.2%). Last year the unadjusted U-3 went from 3.5% to 3.7% (up 0.2%) this year it went from 3.3% to 3.4% (up 0.1%). Last year the adjusted U-3 went from 3.7% to 3.9%. This year it went from… wait for it… 3.5% to 3.5%… what? Yes, it was unchanged. On a seasonally adjusted basis, unemployment is exactly the same as last month (i.e. one of the best months in recorded history). What about Labor Force Participation? Unchanged at 63.2%… slightly off recent highs of 63.3% which it reached in October. The only “fly in the ointment” was actual unadjusted employment which was down slightly while adjusted Employment was still up by 145,000.
December Jobs Report
- Adjusted U-3 was Unchanged at 3.5%!
- Unadjusted U-3 was up slightly from 3.3% to 3.4%!
- Unadjusted U-6 was Up from 6.5% to 6.7%
- Labor Force Participation was unchanged at 63.2%.
- Unadjusted Employment down slightly while adjusted Employment was up by 145,000.
According to the Commissioner of the U.S. Bureau of Labor Statistics:
Nonfarm payroll employment rose by 145,000 in December, and the unemployment rate was unchanged at 3.5 percent. Notable employment gains occurred in retail trade and health care, while mining lost jobs. In 2019, payroll employment growth totaled 2.1 million, compared with a gain of 2.7 million in 2018.
Of course, he is talking about “Seasonally Adjusted Jobs” from the “Current Population Survey (CPS)”
rather than looking at the results reported by actual companies in their “Current Employment Statistics survey (CES)”This was not a bad jobs report!
For more info see our Current Unemployment Chart and Current U.S. Employment Chart commentary.
See Current Unemployment Chart for more info.
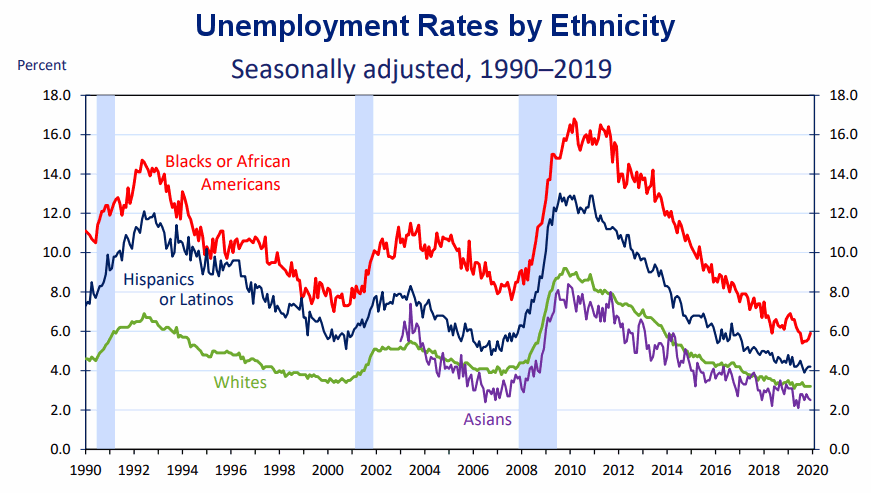
December Unemployment by Ethnicity
The unemployment rate among Blacks and Hispanics ticked up in December but is still well below 2001 and 2007 lows at just above 4%. However, white unemployment held steady and Asian unemployment fell slightly.
 Source: Bureau of Labor Statistics Charts
U1 through U6 Unemployment Rates
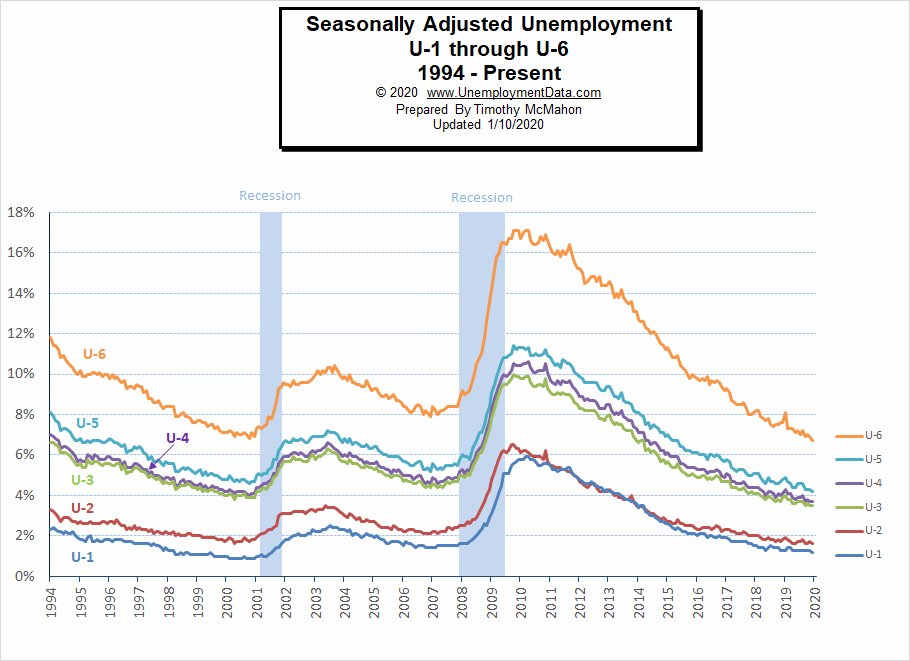
As we can see from the above chart all the various measurements of Seasonally Adjusted Unemployment from U-1 through U-6 are near or below record lows. Some are flat for the month while others actually fell. (Blue bars represent recessions) For more information about the various measurements of unemployment see What Is U-6 Unemployment?
Duration of Unemployment
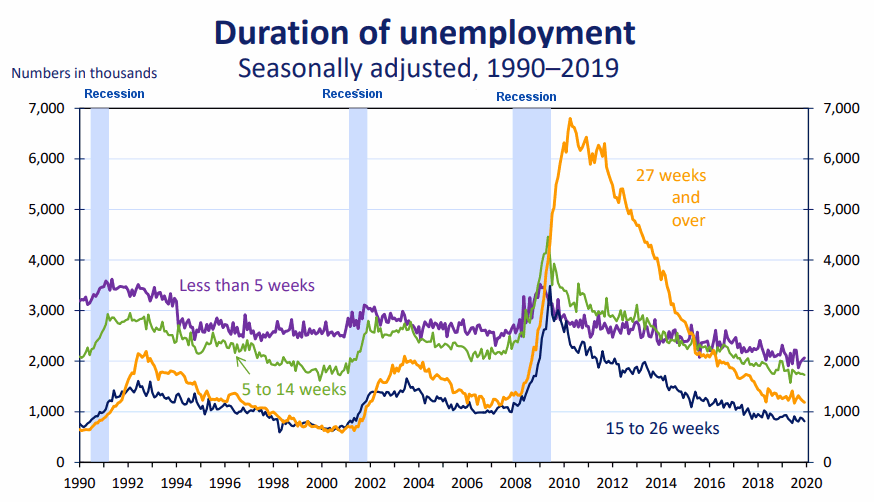
Obviously, the worse the economy is, the longer it takes for the average person to find a job. But not everyone can find a job in 5 weeks or less no matter how good the economy is. Generally, those are the people who already have a job when they leave their old job. But the falling number of people taking over 27 weeks to find a new job is a good indicator of a healthy economy.
In this chart, we can see that the “long term unemployed” have fallen drastically since the last recession. We can also see that most people are now unemployed less than 5 weeks (i.e. the purple line is above all the other lines), so a healthy rotation is occurring as people move to better jobs opening up lower-paid jobs for new employees.
Source: Bureau of Labor Statistics Charts
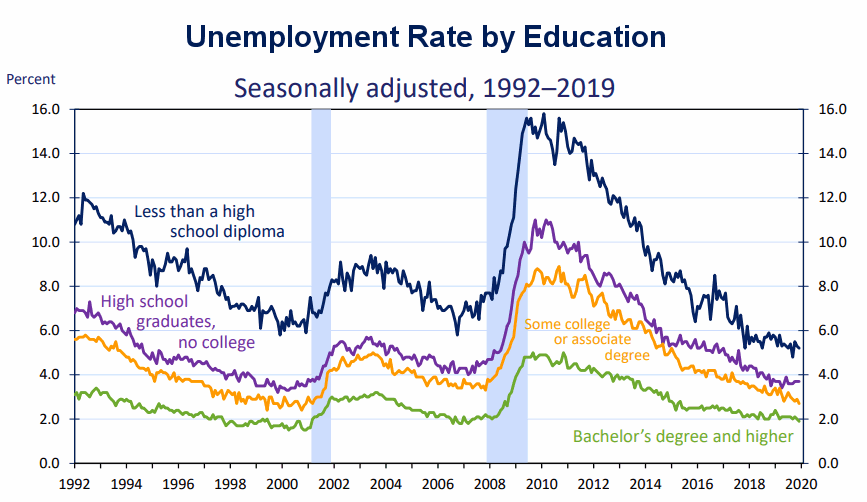
Unemployment by Education
Even during periods of recession / high unemployment those with higher levels of education tend to retain their jobs while those with less education tend to lose theirs. This makes sense as it is harder to replace highly educated/skilled employees and they tend to hold more essential positions. In December High School grads with no college seemed to fare the worst while those with some college saw their unemployment rate actually decline.
Data Source: BLS Labor Productivity
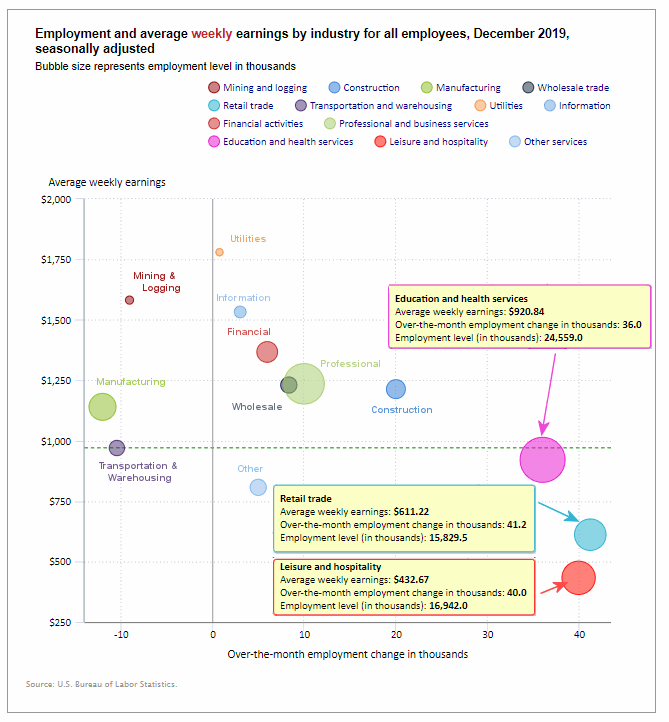
Employment by Sector
The employment “bubble chart” gives us a good representation of how each sector of the economy is doing (employment wise). As we can see from the chart below, the biggest gainer (furthest to the right on the chart) was Retail which is to be expected in December with an increase of 41.2 thousand jobs. Leisure and Hospitality was a close second with an increase of 40 thousand jobs. Education and Health Services added 36,000 jobs. Construction added 20,000 jobs. Professional and Business Services added 10,000 jobs, Wholesale added 8,300 jobs, Financial Services added 6,000 jobs, Other Services added 5,000 jobs, Information added 3,000 jobs, and even little utilities added 800 jobs.
On the losing side, Manufacturing lost -12,000 jobs, Transportation and Warehousing lost -10,400 jobs and Mining and Logging lost -7,000 seasonally adjusted jobs.
Average weekly wages fell slightly in December to $971.38 from $973.18 in November up from $969.39 in October and $959.76 in June.
(See the table below for details.)
How to read this chart:
Bubbles location on the chart tell us two things:
- Change in Employment Levels over the most recent month.
- Average Weekly earnings.
- The further to the right the bubble the larger the increase in the number of jobs.
- The higher up on the chart the larger the average salary.
Bubble Size tells us:
- Total Employment for the sector.
- Larger bubbles mean more people are employed in that sector.
Employment and Average Weekly Earnings by Industry
December 2019, Seasonally Adjusted
| Industry | Monthly Increase | Average Weekly Earnings | Employment Level |
| Total Private Employment | 139,000 | $971.38 | 129,737,000 |
| Mining and Logging | -9,000 | $1,581.68 | 731,000 |
| Construction | 20,000 | $1,213.29 | 7,551,000 |
| Manufacturing | -12,000 | $1,140.08 | 12,855,000 |
| Wholesale trade | 8,300 | $1,230.41 | 5,963,200 |
| Retail trade | 41,200 | $611.22 | 15,829,500 |
| Transportation and Warehousing | -10,400 | $969.82 | 5,568,100 |
| Utilities | 800 | $1,779.85 | 552,200 |
| Information | 3,000 | $1,532.71 | 2,839,000 |
| Financial Activities | 6,000 | $1,367.14 | 8,737,000 |
| Professional and Business Services | 10,000 | $1,235.34 | 21,651,000 |
| Education and Health Services | 36,000 | $920.84 | 24,559,000 |
| Leisure and Hospitality | 40,000 | $432.67 | 16,942,000 |
| Other Services | 5,000 | $807.08 | 5,959,000 |
Previous Record Low Unemployment (Seasonally Adjusted U-3)
If we consider anything 4% or below as “low” we have had a few “low” stretches as we can see in the table below.
(4% or below in Green)
| Jan | Feb | Mar | Apr | May | Jun | Jul | Aug | Sep | Oct | Nov | Dec | |
| 1950 | 6.5% | 6.4% | 6.3% | 5.8% | 5.5% | 5.4% | 5.0% | 4.5% | 4.4% | 4.2% | 4.2% | 4.3% |
| 1951 | 3.7% | 3.4% | 3.4% | 3.1% | 3.0% | 3.2% | 3.1% | 3.1% | 3.3% | 3.5% | 3.5% | 3.1% |
| 1952 | 3.2% | 3.1% | 2.9% | 2.9% | 3.0% | 3.0% | 3.2% | 3.4% | 3.1% | 3.0% | 2.8% | 2.7% |
| 1953 | 2.9% | 2.6% | 2.6% | 2.7% | 2.5% | 2.5% | 2.6% | 2.7% | 2.9% | 3.1% | 3.5% | 4.5% |
| 1954 | 4.9% | 5.2% | 5.7% | 5.9% | 5.9% | 5.6% | 5.8% | 6.0% | 6.1% | 5.7% | 5.3% | 5.0% |
| 1955 | 4.9% | 4.7% | 4.6% | 4.7% | 4.3% | 4.2% | 4.0% | 4.2% | 4.1% | 4.3% | 4.2% | 4.2% |
| 1956 | 4.0% | 3.9% | 4.2% | 4.0% | 4.3% | 4.3% | 4.4% | 4.1% | 3.9% | 3.9% | 4.3% | 4.2% |
| 1957 | 4.2% | 3.9% | 3.7% | 3.9% | 4.1% | 4.3% | 4.2% | 4.1% | 4.4% | 4.5% | 5.1% | 5.2% |
| 1958 | 5.8% | 6.4% | 6.7% | 7.4% | 7.4% | 7.3% | 7.5% | 7.4% | 7.1% | 6.7% | 6.2% | 6.2% |
| … | … | … | … | … | … | … | … | … | … | … | … | … |
| 1965 | 4.9% | 5.1% | 4.7% | 4.8% | 4.6% | 4.6% | 4.4% | 4.4% | 4.3% | 4.2% | 4.1% | 4.0% |
| 1966 | 4.0% | 3.8% | 3.8% | 3.8% | 3.9% | 3.8% | 3.8% | 3.8% | 3.7% | 3.7% | 3.6% | 3.8% |
| 1967 | 3.9% | 3.8% | 3.8% | 3.8% | 3.8% | 3.9% | 3.8% | 3.8% | 3.8% | 4.0% | 3.9% | 3.8% |
| 1968 | 3.7% | 3.8% | 3.7% | 3.5% | 3.5% | 3.7% | 3.7% | 3.5% | 3.4% | 3.4% | 3.4% | 3.4% |
| 1969 | 3.4% | 3.4% | 3.4% | 3.4% | 3.4% | 3.5% | 3.5% | 3.5% | 3.7% | 3.7% | 3.5% | 3.5% |
| 1970 | 3.9% | 4.2% | 4.4% | 4.6% | 4.8% | 4.9% | 5.0% | 5.1% | 5.4% | 5.5% | 5.9% | 6.1% |
| … | … | … | … | … | … | … | … | … | … | … | … | … |
| 1999 | 4.3% | 4.4% | 4.2% | 4.3% | 4.2% | 4.3% | 4.3% | 4.2% | 4.2% | 4.1% | 4.1% | 4.0% |
| 2000 | 4.0% | 4.1% | 4.0% | 3.8% | 4.0% | 4.0% | 4.0% | 4.1% | 3.9% | 3.9% | 3.9% | 3.9% |
| 2001 | 4.2% | 4.2% | 4.3% | 4.4% | 4.3% | 4.5% | 4.6% | 4.9% | 5.0% | 5.3% | 5.5% | 5.7% |
| … | … | … | … | … | … | … | … | … | … | … | … | … |
| 2018 | 4.1% | 4.1% | 4.1% | 3.9% | 3.8% | 4.0% | 3.9% | 3.9% | 3.7% | 3.7% | 3.7% | 3.9% |
| 2019 | 4.0% | 3.8% | 3.8% | 3.6% | 3.6% | 3.7% | 3.7% | 3.7% | 3.5% | 3.6% | 3.5% | 3.5% |
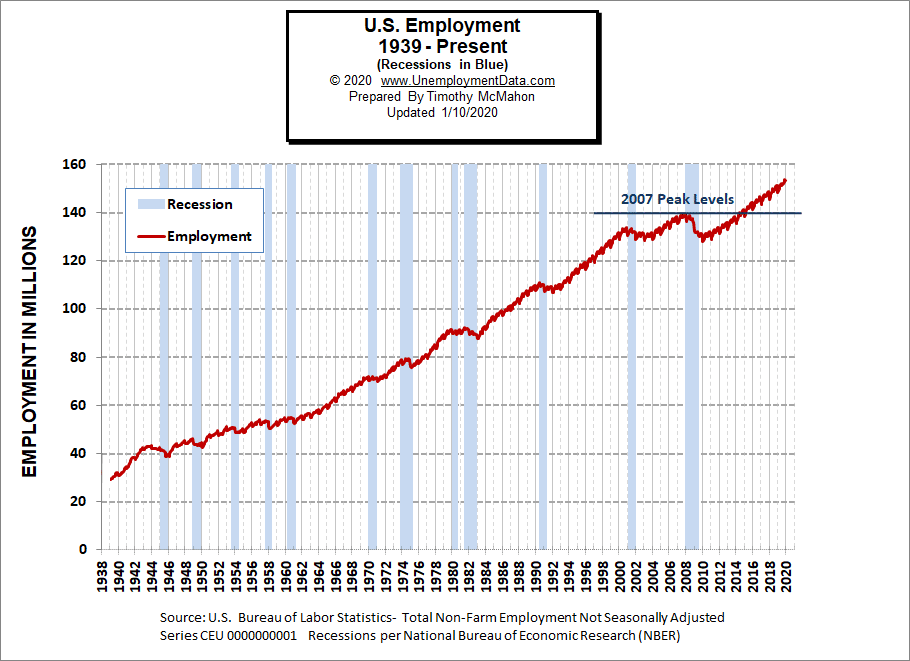
Employment
Historically employment is closely tied to recessions and that is no accident. One of the primary factors in calculating whether the economy is officially in a recession is an increase in the unemployment rate. The chart below provides the Historical Employment Data overlaid on blue bars showing periods of official recessions.
In December employment fell slightly to 153.342 from 153.620 million on an unadjusted basis.
As we can see from the table below from November 2007 to January 2008 there were over 3 million jobs lost but that actually wasn’t all that surprising. Typically January suffers from a reduction in Seasonal workers. Even good years like 2005-2006 saw a reduction of 3 million workers and January 2008 employment levels were still above January 2007 levels. But by January 2009, year-over-year losses exceeded 4 million. By 2010 the economy had lost another 4.2 million. 2011 showed almost a million jobs improvement but the economy was still on shaky ground. It wasn’t until January 2014 that the economy reached January 2007 levels and January 2015 exceeded January 2008 levels.
| Date | Employment in Millions |
| January 2007 | 135.335 |
| November 2007 (Peak) | 139.510 |
| January 2008 | 136.268 |
| January 2009 | 132.042 |
| January 2010 | 127.820 |
| January 2011 | 128.778 |
| January 2012 | 131.113 |
| January 2013 | 133.081 |
| January 2014 | 135.488 |
| January 2015 | 138.511 |
| January 2016 | 141.088 |
| January 2017 | 143.393 |
| January 2018 | 145.428 |
| January 2019 | 148.295 |
| February 2019 | 149.148 |
| March 2019 | 149.864 |
| April 2019 | 150.938 |
| May 2019 | 151.610 |
| June 2019 | 152.243 |
| July 2019 | 151.169 |
| August 2019 | 151.607 |
| September 2019 | 152.016 |
| October 2019 | 153.001 |
| November 2019 | 153.620 |
| December 2019 | 153.342 |
Employment Numbers are “Preliminary” for two months before the BLS considers them finalized due to late coming data.
Current Employment
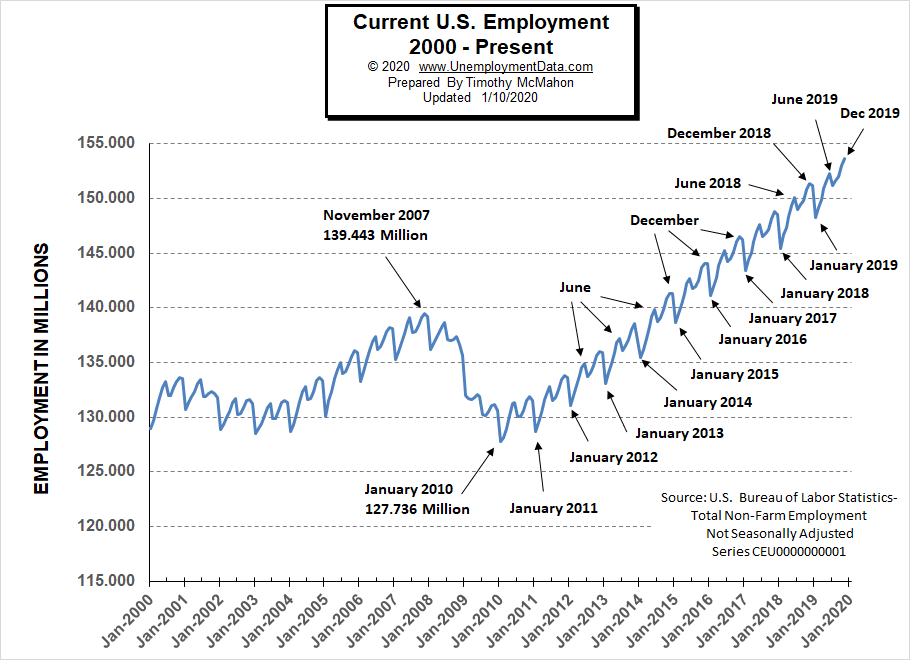
From the above current employment chart, we can see that the low point for each year occurs in January and then a small peak occurs around June with a slight drop around July and then the highest peak in employment happens in November/December. So we can expect a big drop in January.
See Historical Employment and Current Employment for more info.
The Differential between U3 and U6
The previous lows on this chart are at 2.7% in October 2000 and 3.2% in September 2006. In August, September, and October of 2018, the differential between unadjusted U-3 and unadjusted U-6 dropped to 3.5% indicating that we were getting closer to “full employment” but then in December, the U-6 ticked up to 7.5% from 7.2% a month earlier and the differential ticked back up to 3.8%.
Typically the differential peaks in January and this year was no exception. In January 2019 U-6 shot up to 8.8% and U-3 was 4.4% for a differential of 4.4%. In February the differential fell back to 3.6%. From there we saw it fall to 3.3% in May rise in June and then fall back to 3.3% in July and then rose again in August. It was been flat at 3.2% for October and November but rose slightly in December.
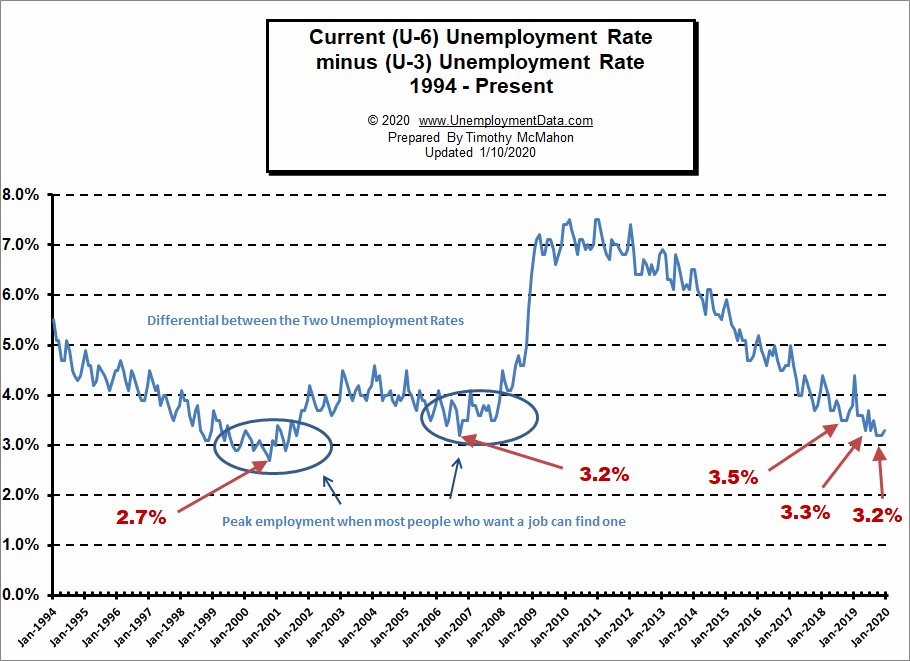
See Current U-6 Unemployment Rate for more info.
U-6 Unemployment
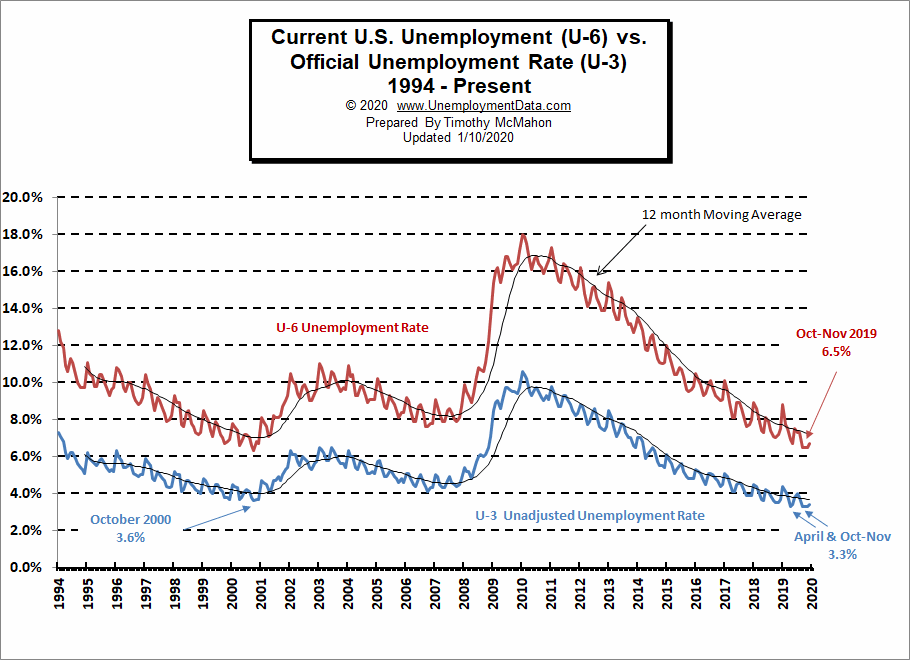
Current U-6 Unemployment Rate for December is 6.7% up slightly from 6.5% from September through November, August 2019 was 7.3%, it was 7.3% in July, 7.5% in June, 6.7% in May, and 8.8% in January.
See Unadjusted U-6 unemployment for more info.
Labor Force Participation Rate
The Current Labor Force Participation Rate for December 2019 was unchanged from November at 63.2% down slightly from 63.3% in October.
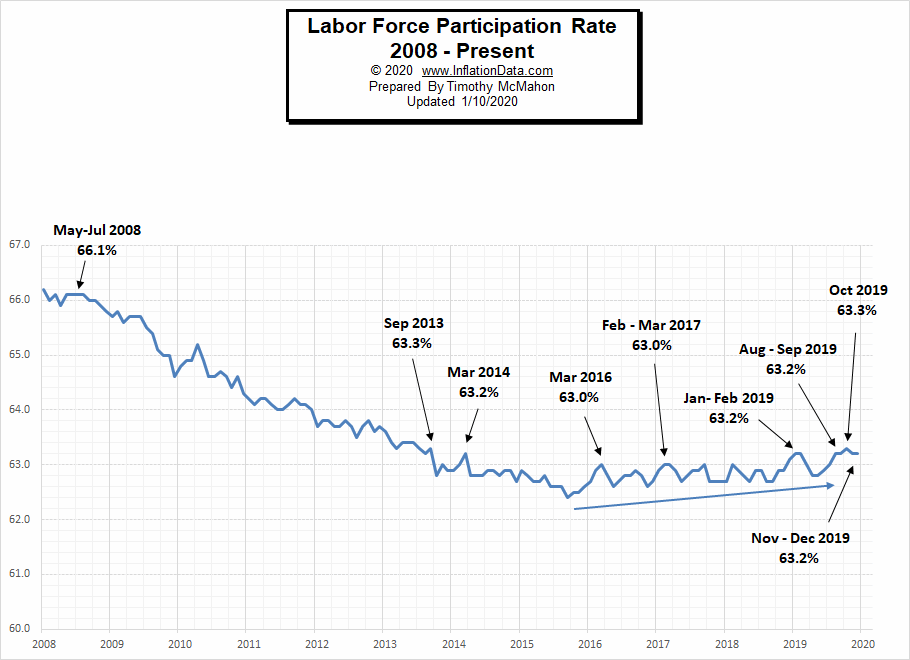
See Labor Force Participation Rate for more information.
If you would like to receive this monthly report and other article updates click here unsubscribe at any time.
Here are some articles you might enjoy in case you missed them:
Read more on UnemploymentData.com.
- A UK Guide to Getting Back to Work After an Injury
- 4 Well-Paying Jobs for Self-Starters
- Workplace Rights in 2020
- Careers to Consider if You Have a Variety of Job Skills
- How To Get Back to Work After a Long Illness
From InflationData.com
- November Annual Inflation Jumps Up But…
- October Inflation has Slight Increase
- Modern Monetary Theory
- Investing to Fight Inflation
- Cumulative Inflation By Category 1996-2016
- If Everything Big is Increasing in Cost at Some Rate Faster than Inflation Why Hasn’t Inflation Risen to Match?
From Financial Trend Forecaster
- Gold is Still King of the Investing Market
- The Markets in Perspective: What Goes up Must Come down?
- Is Bill Gates Right On Energy Investing?
- The Oil Crisis Saudi Arabia Can’t Solve
- 5 Ways Automation Has Changed the Financial World
- Asteroid Mining: Science Fiction or Science?
- The Beginning of a Long-Term “Secular” Bull Market?
- What Does this Rare & Rapid Drop in Manufacturing Mean?
- Bullish Signal Has Only Happened 10 Times in the Last 94 Years.
- Spotting a 178-Year-Old Firm’s Collapse… 2 Years in Advance
- Trade, Impeachment, and the Conviction of Buyers and Sellers
From OptioMoney.com
- Five Business Tips to Help Your Company Thrive
- Have Minimal Car Insurance? What to Do in Case of an Accident
- How to Choose a Residential Roofing Contractor
- Avoid a Money Pit: 4 Vital Inspection Items before Buying an Older Home
- 3 Benefits of Finding a Reliable Family Lawyer
- 4 Hidden Car Costs
From Your Family Finances