The U.S. Bureau of Labor Statistics reported on Unemployment rates by state on Friday October 19th. Seasonally adjusted unemployment rates for September fell over the previous month in 9 states, were higher in 4 states, and stable in 37 states and the District of Columbia.
Nonfarm payroll employment increased in 1 state, decreased in 9 states, and was stable in 37 states and D.C.
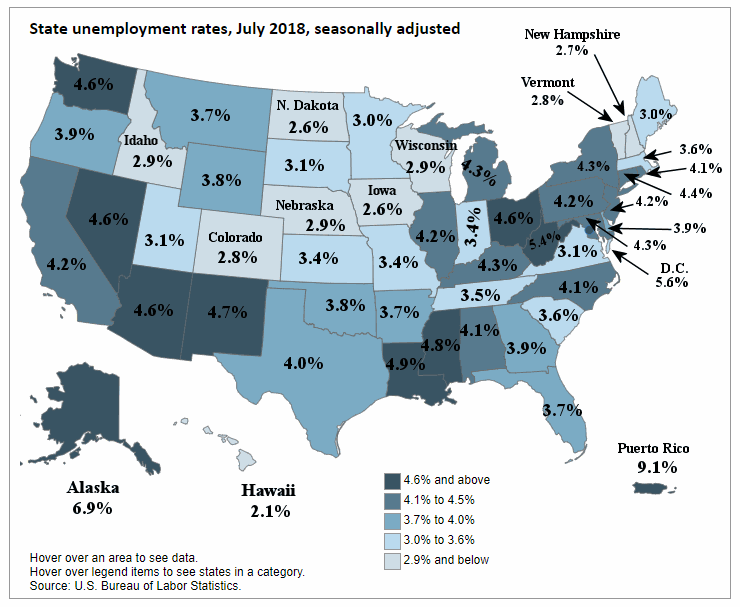
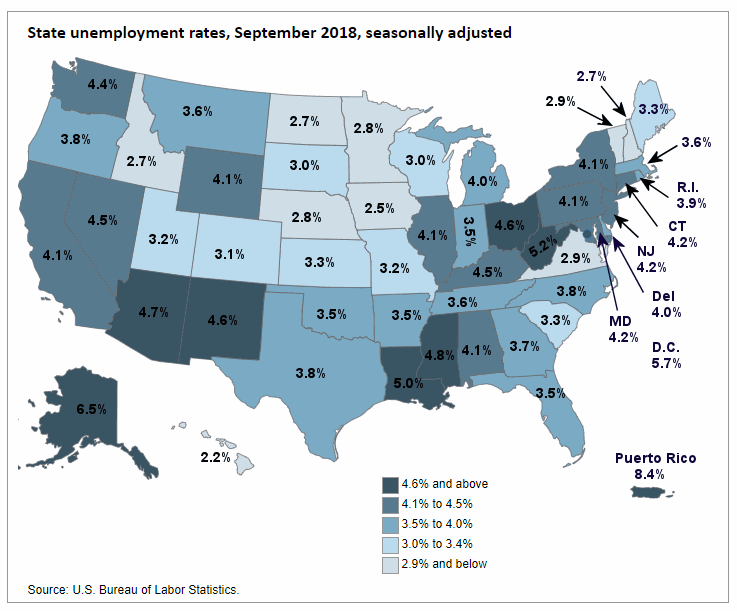
In the following map we can see the states with the lowest unemployment are light colored while the higher unemployment states are darker colored.
Unemployment
Arkansas, California, Idaho, South Carolina, Texas and Washington Set New Series Lows
Hawaii had the lowest seasonally adjusted unemployment rate in September, at 2.2%. Arkansas (3.5%), California (4.1%), Idaho (2.7%), South Carolina (3.3%), Texas (3.8%), and Washington (4.4%) set a new series low since tracking began in 1976. At 6.5% Alaska had the highest jobless rate, not counting Puerto Rico’s 8.4% which is down 2.2% from year ago levels. In total, 13 states had unemployment rates lower than the U.S. figure of 3.7 percent, 12 states plus the District of Columbia and Puerto Rico had higher rates, and 25 states had [Read more…] about Arkansas, California, Idaho, South Carolina, Texas and Washington Set New Unemployment Lows in September

 Building your own brand and making your company stand out from the competition might seem like an impossible task, especially if your business is just starting. However, this is certainly not impossible, and don’t forget that all major global companies once started as small business projects that had the right amount of drive, passion and marketing skills. So, if you too are looking for ways to promote your business at the moment, here are some ideas that might help you do that more effectively than ever.