
 Over the years, I have frequently mentioned the ongoing data revisions of the employment numbers. So much so, that we maintain a list of the originally published employment numbers and the currently published numbers. We also highlight the change every month in our eTrends Newsletter (See Subscription box on Right) when the BLS releases its new numbers.
Last year, the BLS OVERESTIMATED employment in November and December 2024 by more than 1/2 million each month, i.e., 515,000 in December and 678,000 in November. But that was after declaring in February that they were overestimating employment by roughly that amount every month.
Data Fudging or Legit Revision?
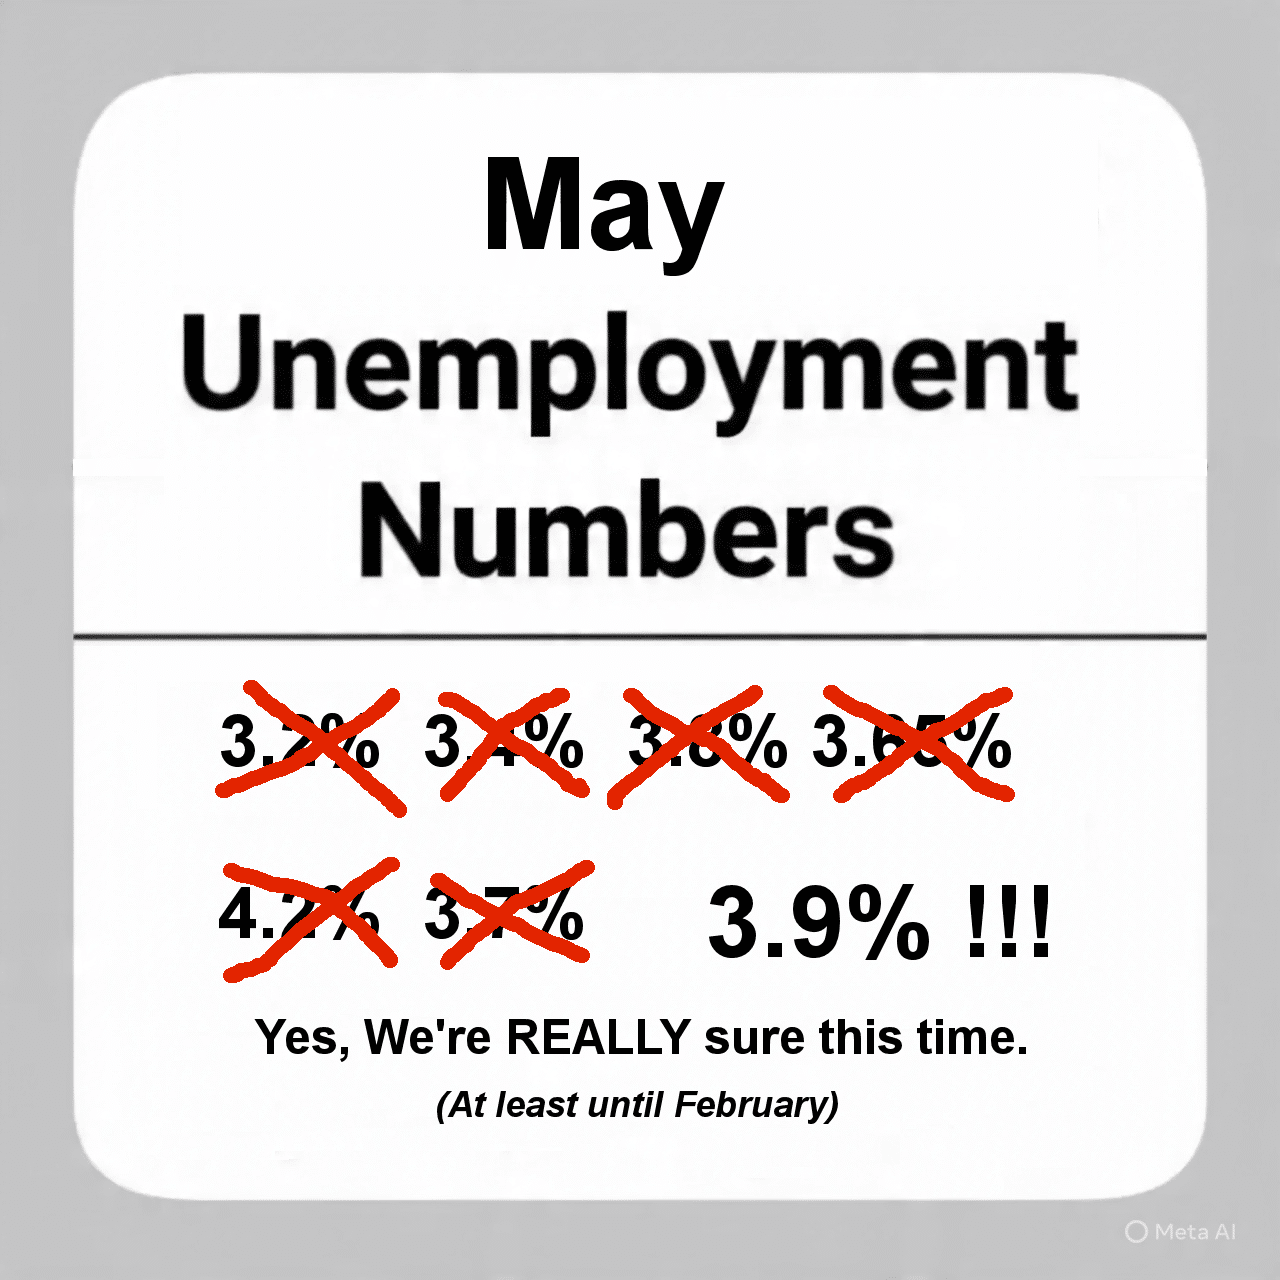
Throughout 2023 and 2024, the BLS consistently published high employment numbers. But then, a couple of months later, when no one was paying much attention, they would adjust the numbers down by roughly half a million.
| Date | Latest BLS Numbers (in Millions) |
Original BLS Numbers (in Millions) |
Change from Original (in thousands) |
| Dec-2024 | 159.943 | 160.458 | -515 |
| Nov-2024 | 159.882 | 160.560 | -678 |
| Oct-2024 | 159.352 | 160.007 | -655 |
| Sep-2024 | 158.527 | 159.177 | -650 |
| Aug-2024 | 158.070 | 158.650 | -580 |
| Jul-2024 | 157.771 | 158.445 | -674 |
| Jun-2024 | 158.722 | 159.392 | -670 |
| May-2024 | 158.256 | 158.918 | -662 |
| Apr-2024 | 157.438 | 158.016 | -578 |
| Mar-2024 | 156.612 | 157.218 | -606 |
| Feb-2024 | 156.007 | 156.555 | -548 |
| Jan-2024 | 154.942 | 155.626 | -684 |
| Dec-2023 | 157.828 | 158.228 | -400 |
| Nov-2023 | 157.950 | 158.461 | -511 |
| Oct-2023 | 157.531 | 157.984 | -453 |
| Sep-2023 | 156.563 | 157.001 | -438 |
| Aug-2023 | 156.107 | 156.302 | -195 |
| July 2023 | 155.779 | 156.126 | -347 |
| June 2023 | 156.701 | 156.963 | -262 |
| May-2023 | 156.038 | 156.306 | -268 |
| Apr-2023 | 155.155 | 155.337 | -182 |
| Mar-2023 | 154.253 | 154.517 | -264 |
| Feb-2023 | 153.818 | 153.955 | -137 |
| Jan-2023 | 152.689 | 152.844 | -155 |
See Changes back to 2010 here.
And the BLS doesn’t just change the last two months as the finalized data arrives. Once a year, in January, they can go back further and then publish the changes in February. And occasionally, those changes go back quite far. As a result of this process, in 2023, the BLS instituted a major revision. They said that Seasonally adjusted data for January 2018 through November 2022 were to be revised.
But… As you can see in the table below, there were changes 10 years further back than 2018 i.e., through 2008. So, to put it nicely, they “misrepresented” the extent of the changes. Typically, the changes were only 1/10th of a percent, with the exception being October 2010.
| Year | Jan | Feb | Mar | Apr | May | Jun | Jul | Aug | Sep | Oct | Nov | Dec |
| 2025 | 4.0% | 4.1% | 4.2% | 4.2% | 4.2% | 4.1% | 4.2% | |||||
| 2024 | 3.7% | 3.9% | 3.8% | 3.9% | 4.0% | 4.1% | 4.3% | 4.2% | 4.1% | 4.1% | 4.2% | 4.1% |
| 2023 | 3.4% | 3.6% | 3.5% | 3.5% | 3.7% | 3.6% | 3.5% | 3.8% | 3.8% | 3.9% | 3.7% | 3.7% |
| 2022 | 4.0% | 3.8% | 3.6% | 3.6% | 3.6% | 3.6% | 3.5% | 3.7% | 3.5% | 3.7% | 3.7% 3.6% |
3.5% |
| 2021 | 6.3% | 6.2% | 6.0% 6.1% |
6.1% | 5.8% | 5.9% | 5.4% | 5.2% | 4.8% | 4.6% 4.5% |
4.2% | 3.9% |
| 2020 | 3.6% 3.5% |
3.5% | 4.4% | 14.7% | 13.3% 13.2% |
11.1% 11.0% |
10.2% | 8.4% | 7.9% | 6.9% | 6.7% | 6.7% |
| 2019 | 4.0% | 3.8% | 3.8% | 3.6% | 3.6% 3.7% |
3.7% 3.6% |
3.7% | 3.7% | 3.5% | 3.6% | 3.5% 3.6% |
3.5% 3.6% |
| 2018 | 4.1% 4.0% |
4.1% | 4.1% 4.0% |
3.9% 4.0% |
3.8% | 4.0% | 3.9% 3.8% |
3.9% 3.8% |
3.7% | 3.7% 3.8% |
3.7% 3.8% |
3.9% |
| 2017 | 4.8% 4.7% |
4.7% 4.6% |
4.5% 4.4% |
4.4% |
4.3% 4.4% |
4.4% 4.3% |
4.3% | 4.4% | 4.2% 4.3% |
4.1% 4.2% |
4.1% 4.2% |
4.1% |
| 2016 | 4.9% 4.8% |
4.9% | 5.0% | 5.0% 5.1% |
4.7% 4.8% |
4.9% | 4.9% 4.8% |
4.9% | 5.0% | 4.9% | 4.6% 4.7% |
4.7% |
| 2015 | 5.7% | 5.5% | 5.5% 5.4% |
5.4% | 5.5% 5.6% |
5.3% | 5.3% 5.2% |
5.1% | 5.1% 5.0% |
5.0% | 5.0% 5.1% |
5.0% |
| 2014 | 6.6% | 6.7% | 6.7% | 6.3% 6.2% |
6.3% | 6.1% | 6.2% | 6.1% | 5.9% | 5.8% 5.7% |
5.8% | 5.6% |
| 2013 | 7.9% 8.0% |
7.7% | 7.6% 7.5% |
7.5% 7.6% |
7.6% 7.5% |
7.6% 7.5% |
7.4% 7.3% |
7.3% 7.2% |
7.2% | 7.3% 7.2% |
7.0% 6.9% |
6.7% |
| 2012 | 8.3% | 8.3% | 8.2% | 8.1% 8.2% |
8.2% | 8.2% | 8.3% 8.2% |
8.1% | 7.8% | 7.9% 7.8% |
7.8% 7.7% |
7.8% 7.9% |
| 2011 | 9.0% 9.1% |
9.0% | 8.9% 9.0% |
9.0% 9.1% |
9.0% | 9.1% | 9.1% 9.0% |
9.1% 9.0% |
9.0% | 8.9% 8.8% |
8.7% 8.6% |
8.5% |
| 2010 | 9.7% 9.8% |
9.7% 9.8% |
9.7% 9.9% |
9.8% 9.9% |
9.6% | 9.5% 9.4% |
9.5% 9.4% |
9.6% 9.5% |
9.6% 9.5% |
9.7% 9.4% |
9.8% | 9.4% 9.3% |
| 2009 | 7.8% | 8.2% 8.3% |
8.6% 8.7% |
8.9% 9.0% |
9.4% | 9.5% | 9.5% | 9.7% 9.6% |
9.8% | 10.1% 10.0% |
9.9% | 9.9% |
| 2008 | 5.0% | 4.8% 4.9% |
5.1% | 4.9% 5.0% |
5.4% | 5.6% | 5.8% | 6.1% | 6.2% 6.1% |
6.6% 6.5% |
6.8% | 7.3% |
See Adjusted Unemployment Rates back to 1949 here.
This is not a new situation with the BLS. Decades ago, I heard a story from James Dale Davidson, founder of the National Taxpayers Union. As he told it, within a few months of being inaugurated, in 1993, Bill Clinton approached Davidson and essentially asked how to best fudge the BLS numbers. Davidson refused to help Clinton with this. But he was convinced that Clinton found other people willing to help. So, this has been going on for at least 30 years.
The Epoch Times says, “It has been rare to find job creation adjusted to the upside. Since 2003, when the Bureau of Labor Statistics introduced a new sample design for revisions, only seven years have highlighted a positive number of revisions.”
The BLS Commissioner’s report released August 1, 2025 included the following statement which may have been what caught Trump’s eye. “Revisions for May and June were larger than normal. The change in total nonfarm payroll employment for May was revised down by 125,000, from +144,000 to +19,000, and the change for June was revised down by 133,000, from +147,000 to +14,000. With these revisions, employment in May and June combined is 258,000 lower than previously reported. (Monthly revisions result from additional reports received from businesses and government agencies since the last published estimates and from the recalculation of seasonal factors.)”
But, as we stated above, the Commissioner’s statement is total nonsense because the revisions in 2024 were MUCH larger. So, why do these revisions bother Trump so much?
- Trump is a “numbers guy” being a businessman first and a politician second; having correct numbers is important to him.
- Having inflated employment numbers (which are then revised down) helped Biden’s economy appear better than it actually was.
- But having inflated employment numbers (which are then revised down) prevents the FED from lowering interest rates as Trump wants.
Increased Scrutiny
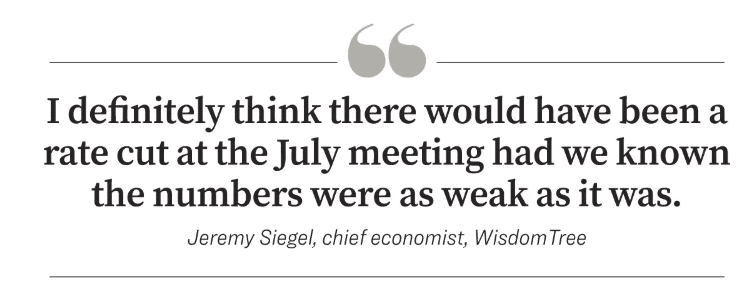
With the history of data uncertainty that has been evident at the BLS, I am not surprised that someone has finally called out the BLS Commissioner. And now it appears that the BLS numbers are affecting FED policy. At least the Chief Economist at Wisdom Tree thinks so.
And Peter C. Earle, senior research fellow at the American Institute for Economic Research said, “Analysts, economists, and financial market participants who build models assuming normality risk systematically underestimating the likelihood of large revisions.”
It’s not just independent economists who have questions.
For the past two months, two key Federal Reserve officials—Governor Christopher Waller and Vice Chair for Supervision Michelle Bowman—have favored a rate cut to prevent further deterioration of the U.S. labor market.
At the August 1st FED meeting, Waller said, “My final reason to favor a cut now is that while the labor market looks fine on the surface, once we account for expected data revisions, private-sector payroll growth is near stall speed, and other data suggest that the downside risks to the labor market have increased.”
Conclusion
We have been pointing out inconsistencies and beating the drum for ages about the BLS number adjustments, and finally, someone is being held accountable. We hope that this will result in better quality data going forward.