
The U.S. Bureau of Labor Statistics (BLS) released its employment / unemployment report for April on May 3rd, 2024.
Employment / Unemployment
![]()
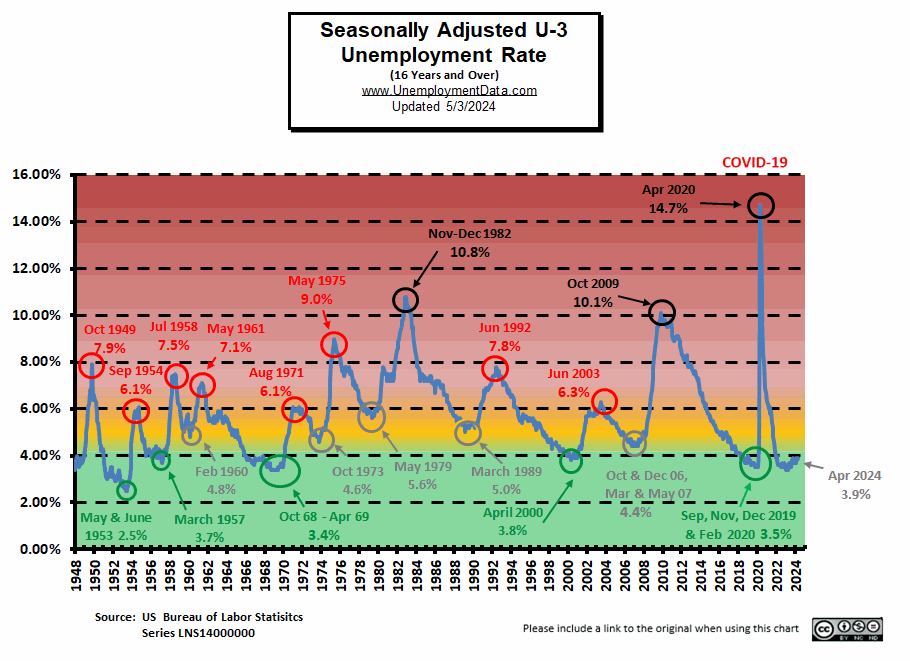
- Seasonally Adjusted U3: 3.9% up from 3.8% in March
- Unadjusted U3: 3.5% down from 3.9% in March
- Unadjusted U6: 6.9% down from 7.4% in March
- Labor Force Participation was 62.7% unchanged
- Unadjusted Employment rose from 157.213 million to 158.016 million
- Next data release June 7th 2024
Summary:
Total Employed increased in April, Unadjusted Unemployment was down, but Seasonally adjusted Unemployment increased.
According to the Commissioner of the U.S. Bureau of Labor Statistics:
“Total nonfarm payroll employment increased by 175,000 in April, and the unemployment rate changed little at 3.9 percent, the U.S. Bureau of Labor Statistics reported today. Job gains
occurred in health care, in social assistance, and in transportation and warehousing.
Both the unemployment rate, at 3.9 percent, and the number of unemployed people, at 6.5 million changed little in April. The unemployment rate has remained in a narrow range of 3.7 percent to 3.9 percent since August 2023.”
You can read the full BLS report here.
As usual, they are talking about “Seasonally Adjusted Jobs”.
Looking at the Unadjusted Establishment Survey report we see…
Originally the BLS reported employment of 157.218 million for March which they adjusted slightly to 157.213 million.
They are currently reporting 158.016 million jobs for April which is actually an increase of 798,000 jobs compared to the original numbers or 803,000 based on their new numbers.
The LFPR was unchanged at 62.7%.
Bad News is Good News for the Market
In the perverse stock market of these post-pandemic days, the market is looking for an excuse for the FED to cut interest rates so “Bad News is Good News” for the market. So, with the Adjusted U3 rising, Mr. Market took that as “Bad News” and rallied.
BUT… was it really even bad news? Or was it Fake News?
First of all, it was only the “Adjusted” U3 that increased, the Unadjusted U3 was down from 3.9% to 3.5% and the Unadjusted U6 was down from 7.4% to 6.9%. So, unadjusted unemployment was good news, making it bad news for the market?
Typically we can think of the adjusted rate as a comparison to the average. So let’s look at what has happened in the UNADJUSTED U3 over the last few years.
Unadjusted U3
| Date | March | April | Change |
| 2024 | 3.9% | 3.5% | -0.4% |
| 2023 | 3.6% | 3.1% | -0.5% |
| 2022 | 3.8% | 3.3% | -0.5% |
| 2021 | 6.2% | 5.7% | -0.5% |
So, what do we see? Over the last few years, the unadjusted U-3 declined -0.5% from March to April so that is the “normal” behavior for March – April. But this year, it only declined -0.4%. So, in perverse Government logic, it increased by +0.1%. Thus, Adjusted U-3 went from 3.8% last month to 3.9% this month. But actual unemployment fell from 3.9% to 3.5% this is a decrease not an increase (just not quite as big a decrease as usual). But Mr. Market was looking for an excuse to rally, so any excuse will do.
As I’ve said many times, January unemployment is the worst and it gets progressively better until summer when all the kids get out of school and the workforce swells making it look like more people are unemployed.
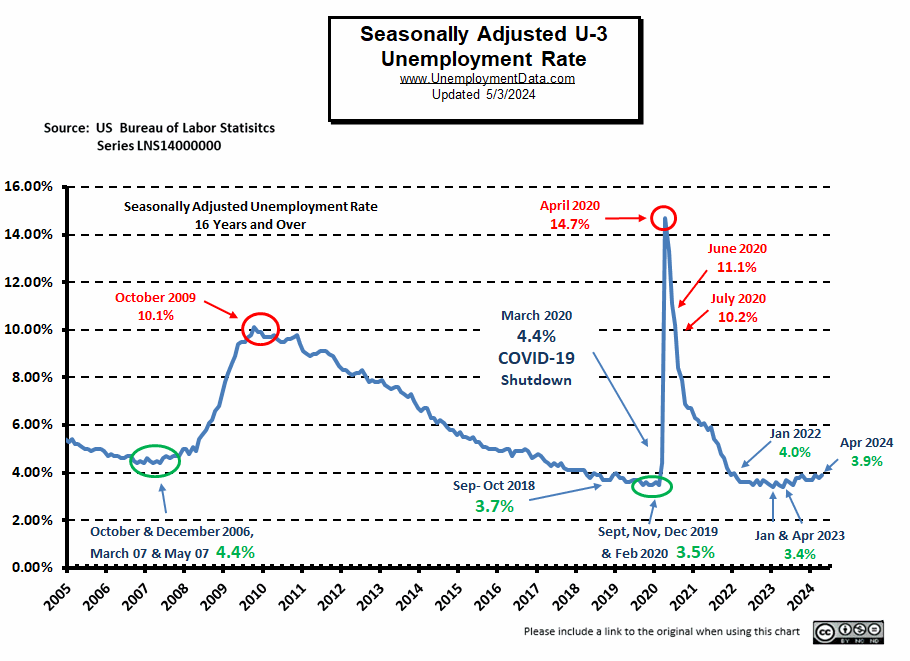
Actually, there are some good reasons for the Seasonal adjustments see Adj vs Unadj. But in this case, looking at the Adjusted numbers compared to last month isn’t going to give you the picture the market was looking for. Looking at the chart below we can see that even at 3.9% unemployment is still in the green, so there is nothing there to convince the FED to start easing.
Current Unemployment Rate Chart
Seasonally Adjusted U3 Unemployment remains above the pre-COVID 2019 cyclical lows of 3.5%, as well as above the lows made early in 2023. But have retreated away from the “yellow zone.”
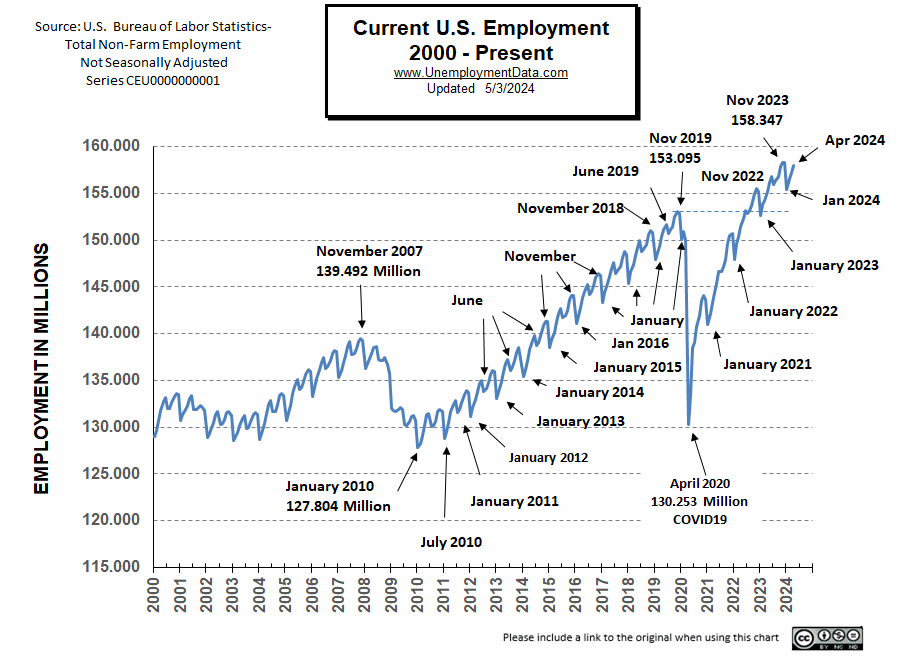
Current Employment Rate
Employment is Up from 157.213 in March to 158.016 in April. Typically, the low point for each year occurs in January and then employment moves almost straight up to a small peak around June.
Employment is 2,815,000 Above Year-Ago Levels and 7.048 million above February 2020 (prior to the Covid Crash)
However, the Civilian Population has also increased by about 8.438 million since February 2020 (probably not counting the millions of illegal aliens that have come since then).
See Current Employment for more information.
BLS: April 2024 Employment by Sector
The BLS employment “bubble chart” based on the Establishment Survey Data gives us a good picture of the Seasonally adjusted employment numbers.
The Bubble’s Size tells us the total Employment for that industry (i.e., larger bubbles mean more people are employed in that sector).
The bubble’s location on the chart tells us that there has been a change in Employment Levels over the most recent month… A bubble further to the right indicates larger job growth. A bubble’s vertical location on the chart shows the average industry salary.
Remember, these are Seasonally Adjusted Numbers, so they aren’t cumulative!
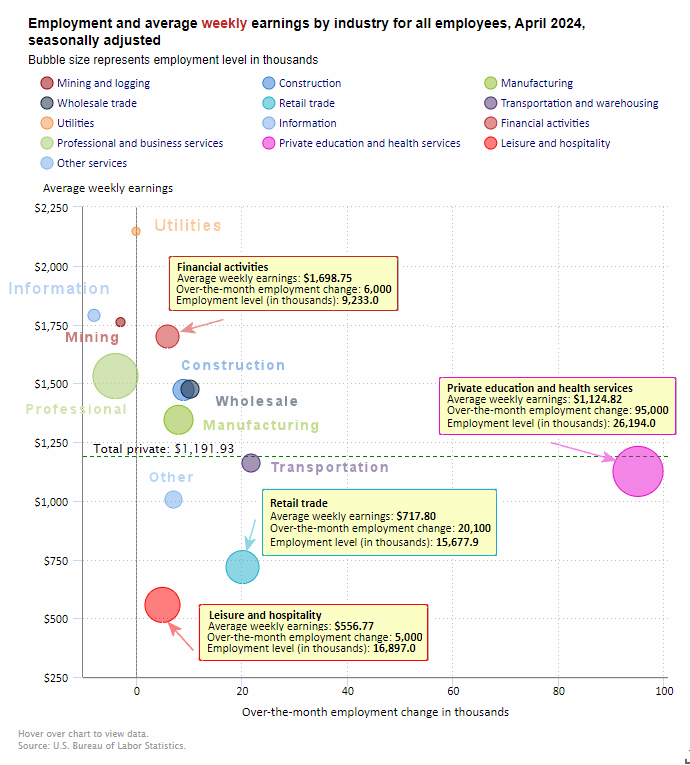
One noticable thing in this month’s chart is the shift of almost all sectors toward the left side of the chart (except Education & Health) and three sectors are actually left of the line (i.e., fewer jobs). But we have to remember that these are Seasonally Adjusted jobs.
According to the BLS, Education and Health added another 95,000 jobs in April on top of the similar gains in February and March. Leisure and Hospitality Services only added 5,000 jobs and Retail added 20,100 jobs.
BLS Average Weekly Wages
This is the first decline in average wages since last May so that is a negative indicator.
| Date | Average Weekly Wage |
| April 2024 | $1,191.93 |
| March 2024 | $1,193.34 |
| February 2024 | $1,185.75 |
| January 2024 | $1,178.16 |
| December 2023 | $1,175.46 |
| November 2023 | $1,173.04 |
| October 2023 | $1,166.20 |
| September 2023 | $1,165.47 |
| August 2023 | $1,163.41 |
| July 2023 | $1,157.28 |
| June 2023 | $1,155.15 |
| May 2023 | $1,146.99 |
| April 2023 | $1,147.58 |
| March 2023 | $1,141.34 |
| February 2023 | $1,141.61 |
| January 2023 | $1,146.14 |
| December 2022 | $1,125.73 |
| November 2022 | $1,129.01 |
| October 2022 | $1,124.01 |
| September 2022 | $1,119.87 |
| August 2022 | $1,116.42 |
| July 2022 | $1,116.54 |
| June 2022 | $1,106.76 |
| May 2022 | $1,105.47 |
| April 2022 | $1,102.01 |
| December 2021 | $1,086.46 |
BLS Employment and Average Weekly Earnings by Industry
April 2024, Seasonally Adjusted Employment
Note that due to “seasonal adjusting,” although they may claim that there was a “monthly increase” (or decrease), there isn’t always an actual increase; you can’t just subtract last month’s “employment level” from this month’s level. For instance, Manufacturing employment was supposed to have gained 8,000 jobs in April. But March had 12,956,000 and April had 12,961,000 which looks more like a 5,000 increase. And Utilities went from 588,000 in March to 587,400 in April which looks like a 600 job decrease but apparently that is normal (since seasonally adjusted it is zero).
| Industry | Monthly Increase | Apr. Ave. Weekly Earnings | Mar. Employment Level | Apr. Employment Level |
| Total Private Employment | 167,000 | $1,191.93 | 134,863,000 | 135,015,000 |
| Mining and Logging | -3,000 | $1,760.04 | 645,000 | 641,000 |
| Construction | 9,000 | $1,471.37 | 8,211,000 | 8,219,000 |
| Manufacturing | 8,000 | $1,344.40 | 12,956,000 | 12,961,000 |
| Wholesale trade | 10,100 | $1,474.85 | 6,158,400 | 6,169,700 |
| Retail trade | 20,100 | $717.80 | 15,659,900 | 15,677,900 |
| Transportation and Warehousing | 21,800 | $1,160.52 | 6,540,500 | 6,575,800 |
| Utilities | 0 | $2,146.68 | 588,000 | 587,400 |
| Information | -8,000 | $1,789.00 | 3,017,000 | 3,013,000 |
| Financial Activities | 6,000 | $1,698.75 | 9,226,000 | 9,233,000 |
| Professional and Business Services | -4,000 | $1,530.61 | 22,954,000 | 22,942,000 |
| Private Education and Health Services | 95,000 | $1,124.82 | 26,101,000 | 26,194,000 |
| Leisure and Hospitality | 5,000 | $556.77 | 16,905,000 | 16,897,000 |
| Other Services | 7,000 | $1,005.18 | 5,901,000 | 5,904,000 |
Source: BLS
ADP® National Employment Report
ADP provides an independent (non-government) estimate of private-sector employment and pay, based on data derived from ADP client payrolls. According to ADP®, In collaboration with Stanford Digital Economy Lab.
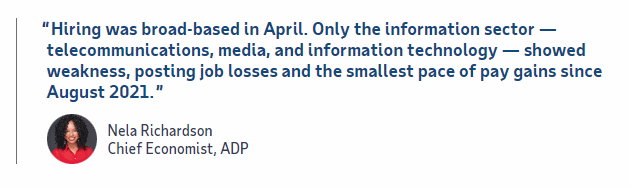
ADP: Private employers added 192,000 jobs in April
- The average pace of hiring has accelerated over the last three months after slowing late last year, almost matching gains made in the first half of 2023. Pay growth continues to slow.
Source: ADP® Pay Insights
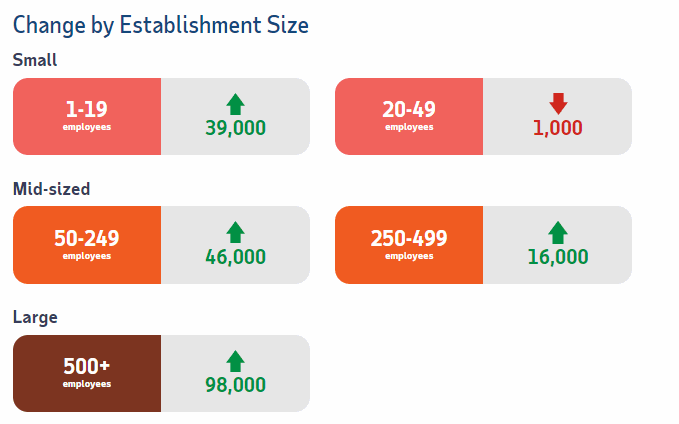
ADP Private Employment by Establishment Size
As we can see from the graphic below most establishment sizes had positive gains. The only sector that declined slightly were those establishments with 20-49 employees.
April ADP Changes:
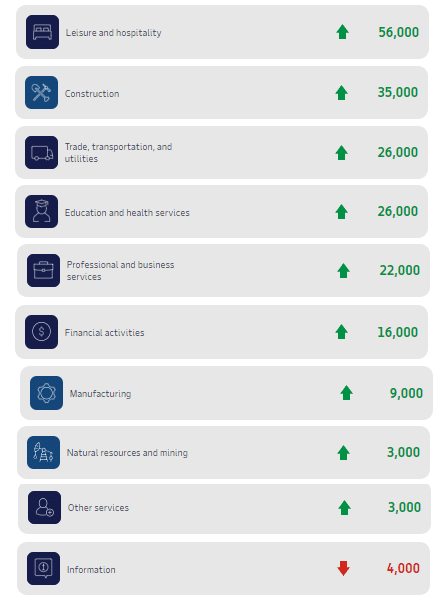
ADP Job Gainers / Losers
ADP provides an entirely different picture of the job situation compared to the BLS perspective showing gains in almost all sectors, except for Information Services.
Unemployment
April’s Seasonally Adjusted Unemployment is up from 3.8% to 3.9% (after doing the exact opposite last month).
Labor Force Participation Rate
The LFPR is unchanged at 62.7%.
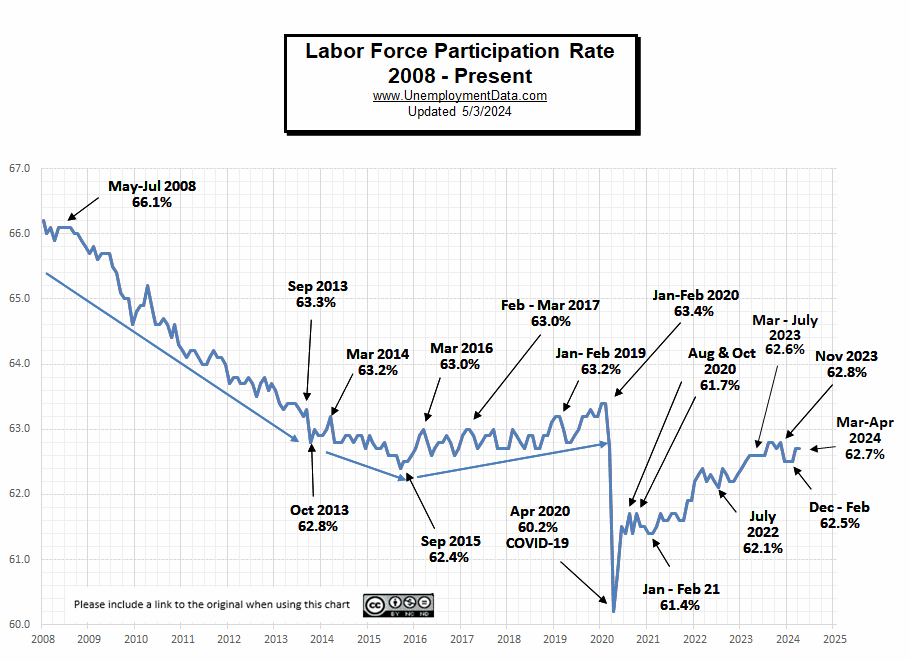 See Labor Force Participation Rate for more information.
Near Full Employment
This chart compares employment levels with the (inverted) unemployment rate.
Full Employment is when everyone who wants a job has one. It is generally considered to be around 3%. After the unemployment rate almost touched the magic full employment line in April 2023, it began moving away (i.e., higher unemployment). This month on an unadjusted basis it got closer again.
Note: The Unemployment rate is inverted to track the employment rate. Neither is Seasonally Adjusted. For more information see Employment vs. Unemployment.
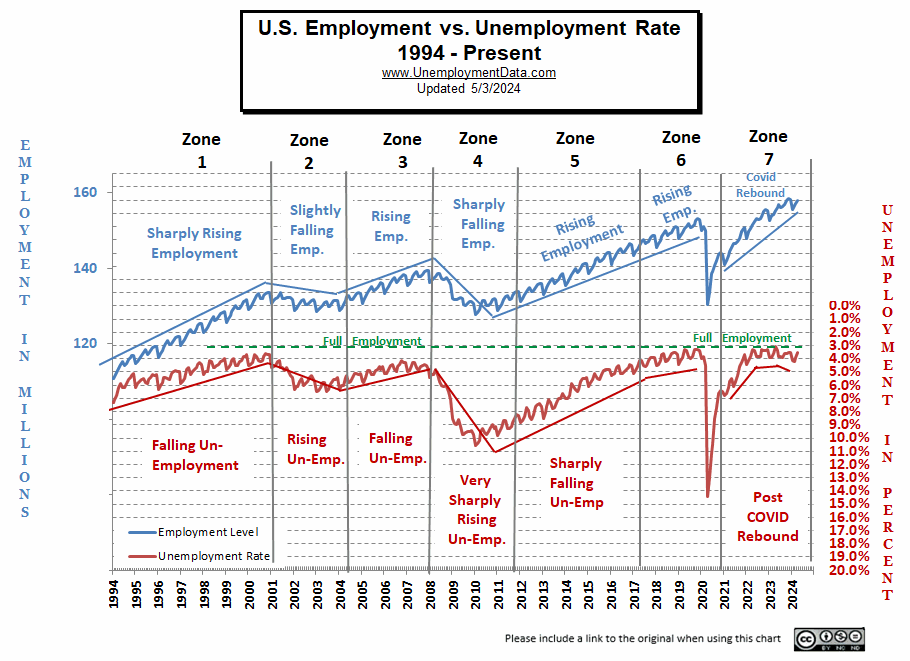
Note: Full employment is not considered to be at zero percent because even when employers are having difficulty finding employees, some people are still unemployed due to either structural unemployment (mismatch between worker skills and job requirements, i.e., not enough training) or simply because they quit their job knowing it would be easy to find another (hopefully better) job. Often referred to as frictional unemployment (there will always be people who have quit or have lost a seasonal job and are in the process of getting a new job).
Seasonally Adjusted U1 through U6 Unemployment Rates
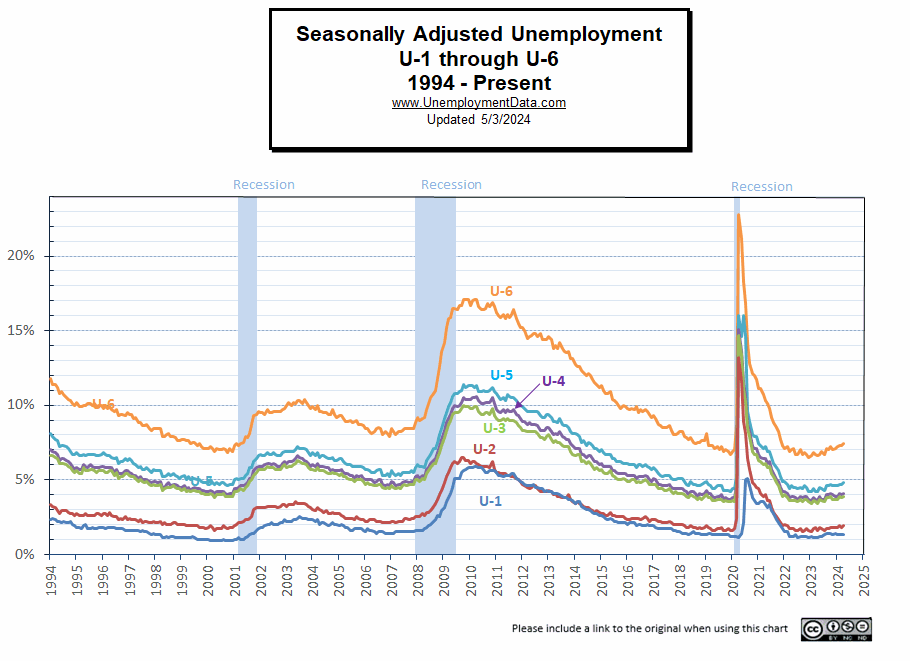 For more information about the various measurements of unemployment, see What Is U-6 Unemployment?
Seasonally Adjusted Unemployment by Education
Unemployment by the less educated rebounded in April after falling drastically in March.
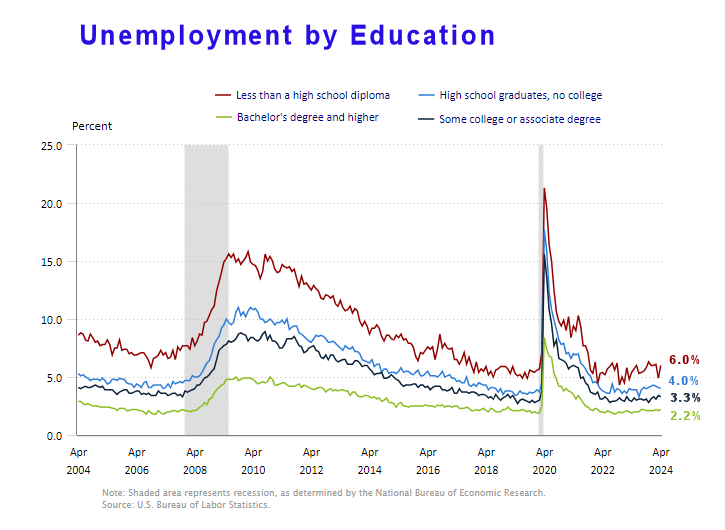
Source: BLS
Employment-Population Ratio
This month we broke out the Employment-Population Ratio by gender. Showing that Men make up a much larger portion of the workforce, i.e., 67.6% of men are employed and only 55.4% of women are employed. But…
As you can see 20 years ago, back in April 2004, almost 72% of men were working and 57.4% of women were working. In 2008 the Great Recession caused a massive decline in employment for both men and women. By December of 2009, only 66.4% of men were working and 55.4% of women. Over the next decade women workers rebounded to 57.5% but men only rebounded to 69.3%.
Now only 67.6% of men are working and 57.0% of women are working so it isn’t women who have left the workforce but men. Perhaps there are more stay-at-home Dads? Or more men decided to retire in 2009 rather than bother returning to the workforce.
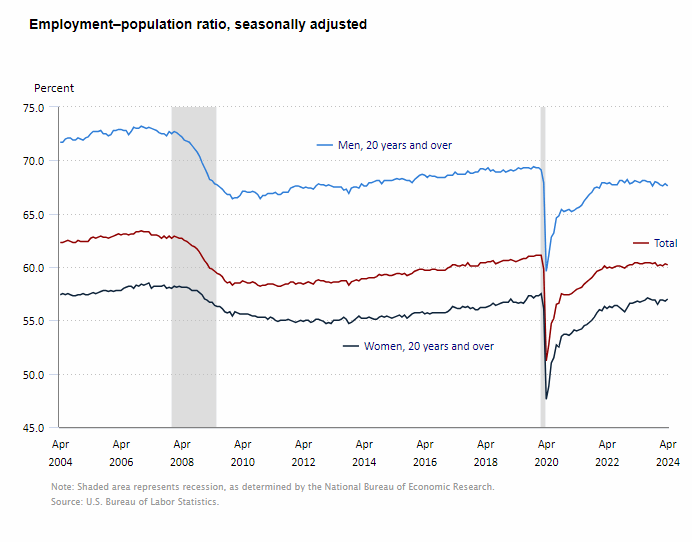 See Employment Population Ratio for more information.
Read more on UnemploymentData.com.
- The Challenges and Triumphs of Working in Emergency Care
- 7 Skills You Need When Starting a Roofing Business
- March 2024 Employment Higher Than Expected
- Exploring the Benefits of a Career in Truck Driving
- Cranes in Construction: A Sky-High Opportunity for Entrepreneurs
From InflationData.com
- 4 Key Factors to Consider When Hedging Against Inflation
- Navigating Economic Turbulence: How Inflationary Pressures Drive Payment Fraud Trends
- March Inflation Causes Market Concern
- Hyperinflation- How a Trickle Can Turn into a Flood
From Financial Trend Forecaster
- NYSE ROC Chart
- NASDAQ ROC Chart
- Economic Education Has Become Economic Disinformation
- The Modern Day Wild West: Crypto Scams And Opportunities
- Global Debt Levels Are a Ticking Time Bomb
- America’s Fiscal Collapse Accelerates
- Crypto 2.0, A Whole New Ballgame
- California’s Latest Hustle: Utility Bills Based on Ratepayers’ Income
- The Barbarous Relic Rides Again
From Elliott Wave University
- Gold: Setting Near-Term Price Targets
- Bob Prechter on the Rich Dad Radio Show
- A.I. Revolution and NVDA: Why Tough Going May Be Ahead
- Free report: ‘Gold Investors’ Survival Guide’
- U.S. Real Estate: A 24% Problem
From OptioMoney
- How to Effectively Manage Credit Cards as a Homeowner
- What are “Moving Loans” and Do You Need One?
- Navigating Currency Exchange: Maximizing Your Money When Moving Abroad
- The True Cost of Neglect: How Deferred Home Maintenance Creates Money Pits
- Financial Factors to Consider When Relocating Your Business
From Your Family Finances