
Highlights from the August 6th Bureau of Labor Statistics (BLS) employment / unemployment report for July.
![]()
- Unadjusted U-3 was Down from 6.1% to 5.7%
- Adjusted U-3 was Down from 5.9% to 5.4%
- Unadjusted U-6 was Down from 10.1% to 9.6%
- Labor Force Participation UP from 61.6% to 61.7%
- Unadjusted Employment fell from 146.603 million to 146.470 million
According to the Commissioner of the U.S. Bureau of Labor Statistics:
Nonfarm payroll employment increased by 943,000 in July, and the unemployment rate fell by 0.5 percentage point to 5.4 percent. Notable job gains occurred in leisure and hospitality, in local government education, and in professional and business services.
As usual, they are talking about “Seasonally Adjusted Jobs” from the “Current Population Survey (CPS)” rather than looking at the results reported by actual companies in their “Current Employment Statistics survey (CES)”
But looking at the CES report we see…
Originally the BLS reported 146.517 for June which they adjusted to 146.603 million. For July they are currently saying employment is 146.470 million.
which is actually a decrease of 47,000 jobs based on their original estimates or a decrease of 133,000 based on their updated numbers but not as bad as the average, so on a seasonally adjusted basis it was an increase.
Current Employment
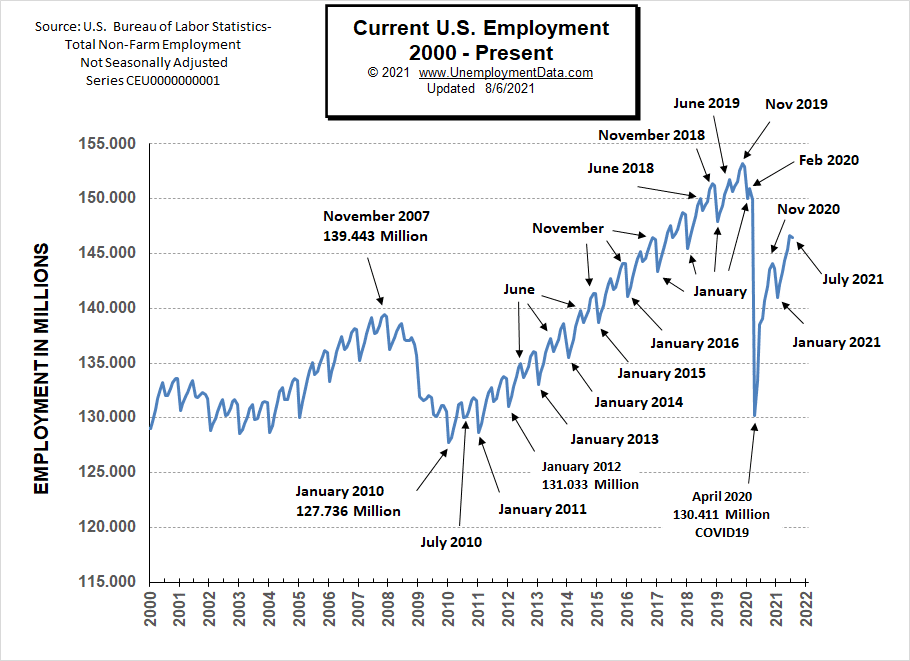
As we can see from the chart there was a slight downtick in actual employment in July. A closer look at the chart will reveal that typically June is the peak and July is slightly lower so there is nothing unusual about July being down but by “seasonally adjusting” they call it a “943,000 increase” meaning that it didn’t drop as much in July as usual.
Typically the low point for each year occurs in January and then it moves almost straight up to a small peak around June with a slight drop around July and then the highest peak in employment happens in November with a slight decline in December. As expected January 2021 employment dropped sharply (perhaps a bit more sharply than typical). But February through June saw the typical rebound.
See Current Employment for more info.
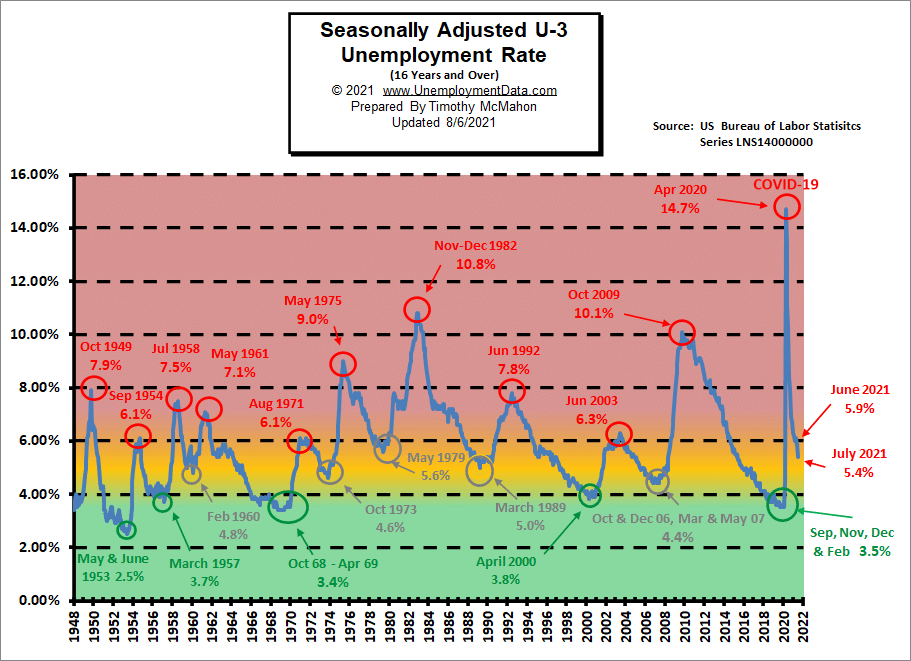
Unemployment Enters “Yellow Zone”
In the chart below the “red zone” indicates things are really bad. Historically “Bad” for the U-3 usually starts at around 6.5%-7% and stops at around 10% with only two previous occasions getting into the 10% range. In 2020 COVID sent unemployment from really good (green zone) to really bad virtually overnight.
The yellow zone (from about 4% to 6%) is the normal operating range and when unemployment stays in this range the economy is generally doing OK. Below 4% and the economy is doing great and above 7% and the economy is in for trouble. Currently, the adjusted U-3 unemployment rate has fallen from the horrendous 14.7% of April 2020 down to 5.4%.
The PEAKS in 1954, 1971, and 2003 were at 6.3% and that was the worst it got for those recessions. The September 1954 and August 1971 peaks were only at 6.1%. July’s 5.4% Adjusted U-3 is not great but not bad.
Employment by Sector
The employment “bubble chart” shows how each sector of the economy is doing (employment-wise on a seasonally adjusted basis).
Typically January is the worst month with retailers and hospitality reducing seasonal staff. In January 2021 Leisure and Hospitality lost -61,000 jobs. As things begin to reopen, February- April saw Leisure and Hospitality GAIN a massive number of jobs.
In June Leisure and Hospitality gained 343,000 jobs and in July it gained another 380,000.
Professional and Business Services gained 60,000 jobs on top of June’s 72,000 jobs, Retail lost -5,500 after gaining 67,100 jobs in June, Education and Health gained 59,000 jobs in June, and another 87,000 jobs in July.
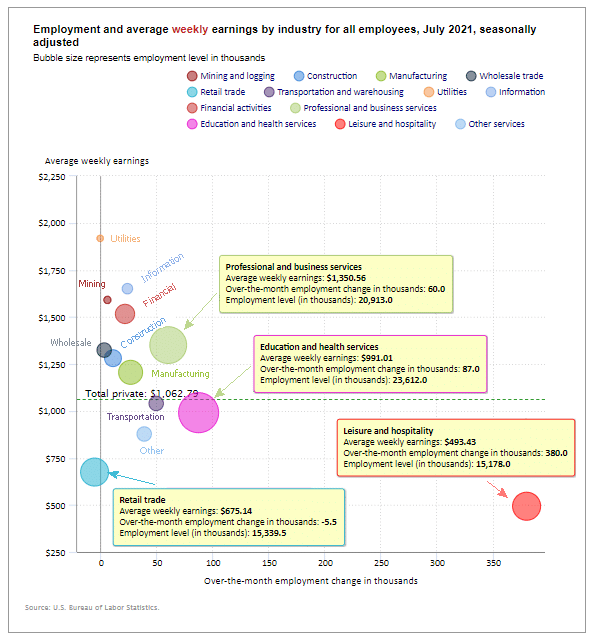
Average weekly wages fell from $1,058.52 in May to $1,054.88 in June but rose to $1,062.79 in July.
(See the table below for details.)
How to read this chart:
The bubbles location on the chart tell us two things:
- Change in Employment Levels over the most recent month.
- Average Weekly earnings.
- The further to the right the bubble the larger the increase in the number of jobs.
- The higher up on the chart the larger the average salary.
Bubble Size tells us:
- Total Employment for the sector.
- Larger bubbles mean more people are employed in that sector.
Employment and Average Weekly Earnings by Industry
July 2021, Seasonally Adjusted
| Industry | Monthly Increase | Average Weekly Earnings | Employment Level |
| Total Private Employment | 703,000 | $1,062.79 | 124,768,000 |
| Mining and Logging | 6,000 | $1,590.68 | 637,000 |
| Construction | 11,000 | $1,280.98 | 7,421,000 |
| Manufacturing | 27,000 | $1,205.69 | 12,366,000 |
| Wholesale trade | 2,800 | $1,324.02 | 5,709,700 |
| Retail trade | -5,500 | $675.14 | 15,339,500 |
| Transportation and Warehousing | 49,700 | $1,040.26 | 5,782,500 |
| Utilities | -100 | $1,918.30 | 538,800 |
| Information | 24,000 | $1,650.53 | 2,742,000 |
| Financial Activities | 22,000 | $1,516.41 | 8,827,000 |
| Professional and Business Services | 60,000 | $1,350.56 | 20,913,000 |
| Education and Health Services | 87,000 | $991.01 | 23,612,000 |
| Leisure and Hospitality | 380,000 | $493.43 | 15,178,000 |
| Other Services | 39,000 | $877.61 | 5,701,000 |
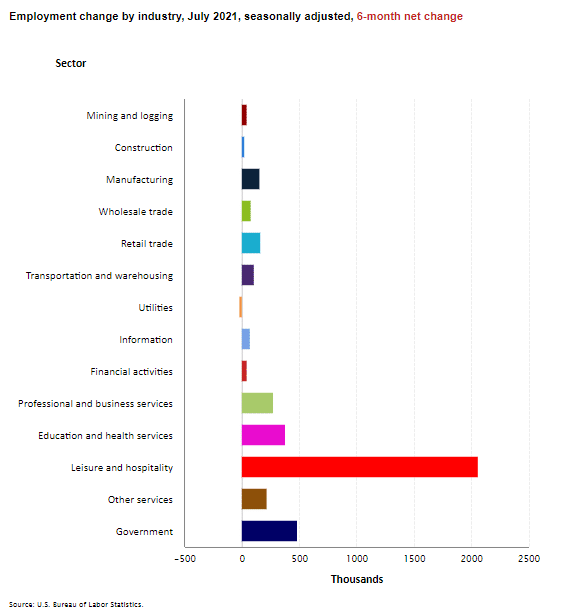
Another way to look at these monthly numbers. This one includes government jobs and shows the magnitude of the gain in Leisure and Hospitality jobs and how small the gains in the other industries (except Government) were.
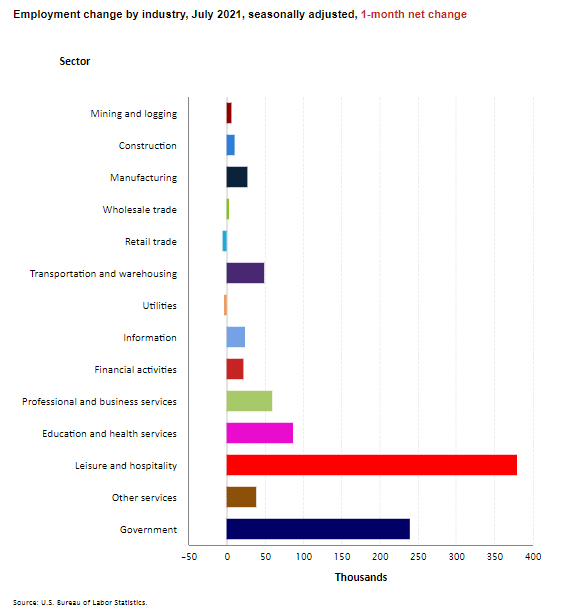
Looking at it over 6 months we can see the improvement in all the sectors. Obviously, Leisure and Hospitality is by far the biggest gainer but it also lost the most during the COVID shutdown.
Source: BLS
U1 through U6 Unemployment Rates
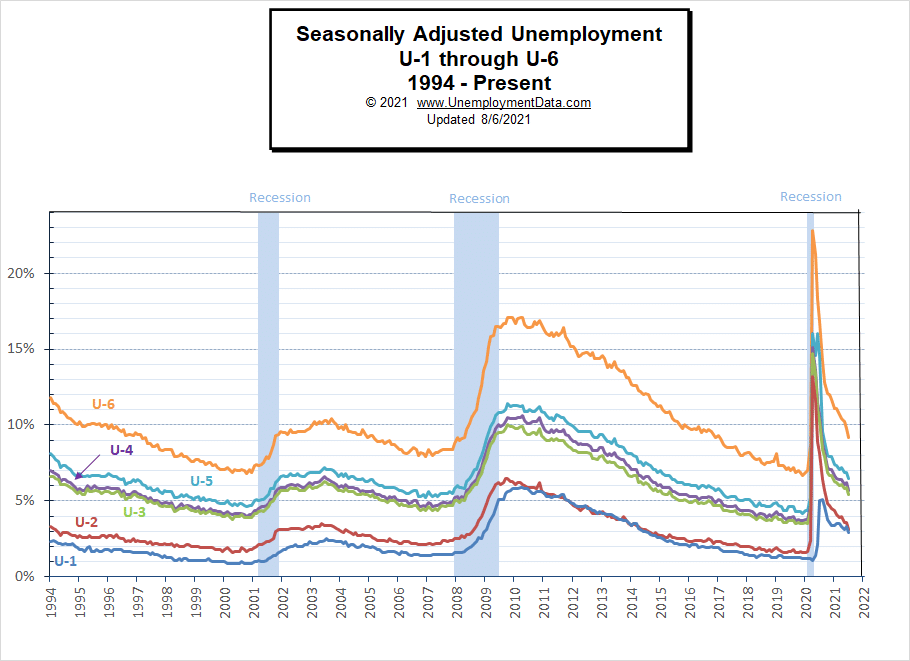
This month the National Bureau of Economic Research (NBER) has determined that a sharp upturn occurred only 2 months after the recession started, so officially the recession bottomed in April 2020. The previous peak in economic activity occurred in February 2020 making it the shortest recession on record. And we can see that unemployment did fall rather quickly.
For more information about the various measurements of unemployment see What Is U-6 Unemployment?
Previous Record Low Unemployment (Seasonally Adjusted U-3)
If we consider anything 4% or below as “low” we have had a few “low” stretches as we can see in the table below.
(4% or below in Green)
| Jan | Feb | Mar | Apr | May | Jun | Jul | Aug | Sep | Oct | Nov | Dec | |
| 1950 | 6.5% | 6.4% | 6.3% | 5.8% | 5.5% | 5.4% | 5.0% | 4.5% | 4.4% | 4.2% | 4.2% | 4.3% |
| 1951 | 3.7% | 3.4% | 3.4% | 3.1% | 3.0% | 3.2% | 3.1% | 3.1% | 3.3% | 3.5% | 3.5% | 3.1% |
| 1952 | 3.2% | 3.1% | 2.9% | 2.9% | 3.0% | 3.0% | 3.2% | 3.4% | 3.1% | 3.0% | 2.8% | 2.7% |
| 1953 | 2.9% | 2.6% | 2.6% | 2.7% | 2.5% | 2.5% | 2.6% | 2.7% | 2.9% | 3.1% | 3.5% | 4.5% |
| 1954 | 4.9% | 5.2% | 5.7% | 5.9% | 5.9% | 5.6% | 5.8% | 6.0% | 6.1% | 5.7% | 5.3% | 5.0% |
| 1955 | 4.9% | 4.7% | 4.6% | 4.7% | 4.3% | 4.2% | 4.0% | 4.2% | 4.1% | 4.3% | 4.2% | 4.2% |
| 1956 | 4.0% | 3.9% | 4.2% | 4.0% | 4.3% | 4.3% | 4.4% | 4.1% | 3.9% | 3.9% | 4.3% | 4.2% |
| 1957 | 4.2% | 3.9% | 3.7% | 3.9% | 4.1% | 4.3% | 4.2% | 4.1% | 4.4% | 4.5% | 5.1% | 5.2% |
| 1958 | 5.8% | 6.4% | 6.7% | 7.4% | 7.4% | 7.3% | 7.5% | 7.4% | 7.1% | 6.7% | 6.2% | 6.2% |
| … | … | … | … | … | … | … | … | … | … | … | … | … |
| 1965 | 4.9% | 5.1% | 4.7% | 4.8% | 4.6% | 4.6% | 4.4% | 4.4% | 4.3% | 4.2% | 4.1% | 4.0% |
| 1966 | 4.0% | 3.8% | 3.8% | 3.8% | 3.9% | 3.8% | 3.8% | 3.8% | 3.7% | 3.7% | 3.6% | 3.8% |
| 1967 | 3.9% | 3.8% | 3.8% | 3.8% | 3.8% | 3.9% | 3.8% | 3.8% | 3.8% | 4.0% | 3.9% | 3.8% |
| 1968 | 3.7% | 3.8% | 3.7% | 3.5% | 3.5% | 3.7% | 3.7% | 3.5% | 3.4% | 3.4% | 3.4% | 3.4% |
| 1969 | 3.4% | 3.4% | 3.4% | 3.4% | 3.4% | 3.5% | 3.5% | 3.5% | 3.7% | 3.7% | 3.5% | 3.5% |
| 1970 | 3.9% | 4.2% | 4.4% | 4.6% | 4.8% | 4.9% | 5.0% | 5.1% | 5.4% | 5.5% | 5.9% | 6.1% |
| … | … | … | … | … | … | … | … | … | … | … | … | … |
| 1999 | 4.3% | 4.4% | 4.2% | 4.3% | 4.2% | 4.3% | 4.3% | 4.2% | 4.2% | 4.1% | 4.1% | 4.0% |
| 2000 | 4.0% | 4.1% | 4.0% | 3.8% | 4.0% | 4.0% | 4.0% | 4.1% | 3.9% | 3.9% | 3.9% | 3.9% |
| 2001 | 4.2% | 4.2% | 4.3% | 4.4% | 4.3% | 4.5% | 4.6% | 4.9% | 5.0% | 5.3% | 5.5% | 5.7% |
| … | … | … | … | … | … | … | … | … | … | … | … | … |
| 2018 | 4.1% | 4.1% | 4.1% | 3.9% | 3.8% | 4.0% | 3.9% | 3.9% | 3.7% | 3.7% | 3.7% | 3.9% |
| 2019 | 4.0% | 3.8% | 3.8% | 3.6% | 3.6% | 3.7% | 3.7% | 3.7% | 3.5% | 3.6% | 3.5% | 3.5% |
| 2020 | 3.6% | 3.5% | 4.4% | 14.7% | 13.3% | 11.1% | 10.2% | 8.4% | 7.9% | 6.9% | 6.7% | 6.7% |
| 2021 | 6.3% | 6.2% | 6.0% | 5.8% | 5.9% | 5.4% |
Historical Employment
Historically employment is closely tied to recessions because one of the primary determining factors of whether the economy is officially in a recession is an increase in the unemployment rate. The chart below provides the Historical Employment Data overlaid on blue bars showing periods of official recessions. In April 2020, the number of people employed fell below the 2007 peak, near the lows of the 2008-2010 crash. By August 2020, it had rebounded back above the 2007 peak level but it is still well below the 2019 peak.
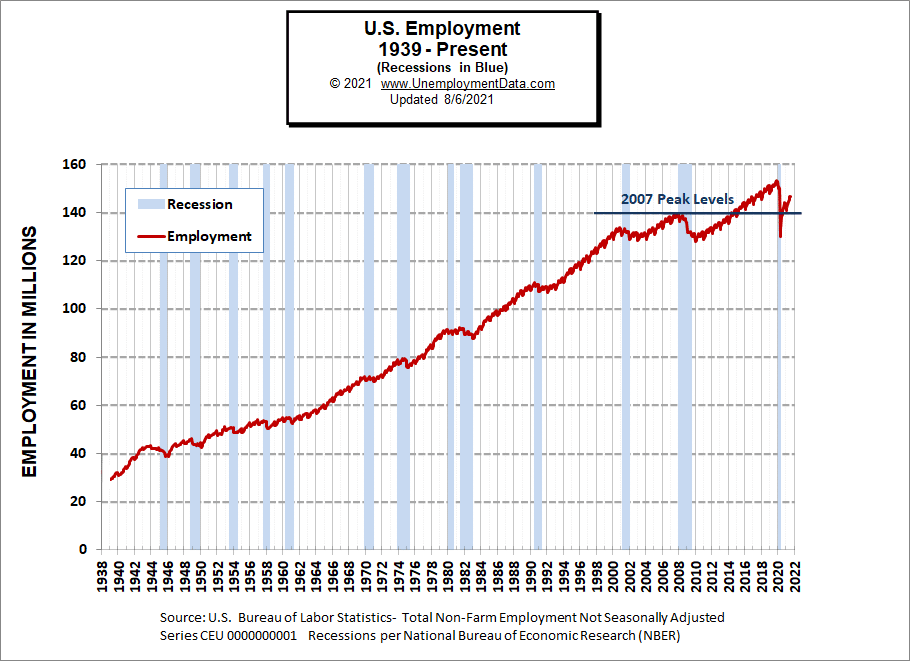
See Historical Employment Data for more info.
Current Seasonally Adjusted Unemployment
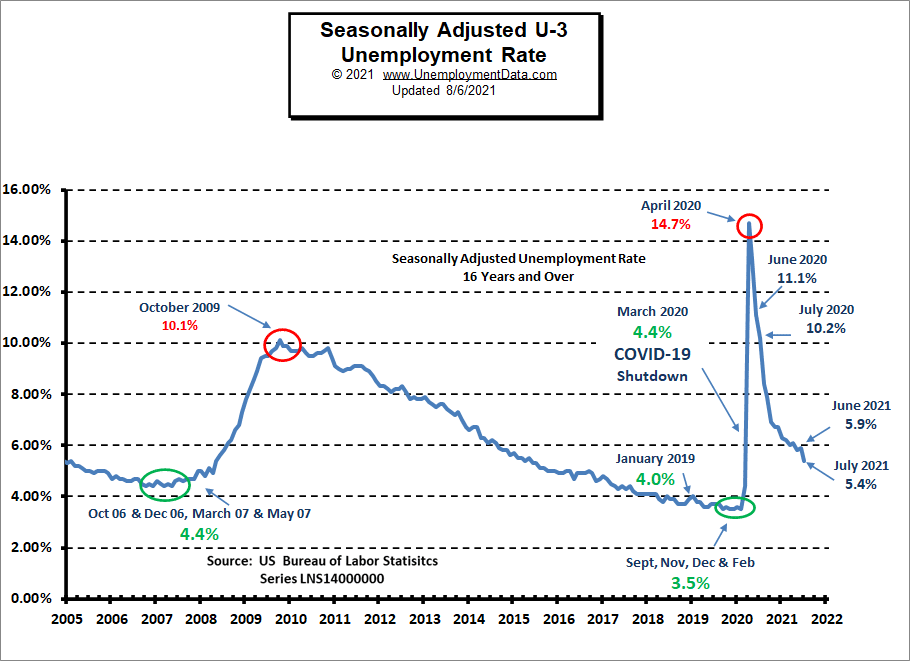 See Current Employment Commentary for more info.
Unemployment by Education
Typically those with a Bachelor’s degree are relatively immune to unemployment. Although during the 2008 recession college grads’ unemployment rose to slightly above 4%. Those with a Bachelor’s degree or higher had a low of 1.9% unemployment in February 2019 and rose to 8.4% in April 2020. Unemployment fell to 3.8% in December but rose back to 4% in January and was 3.2% in May rising to 3.5% in June.
Unemployment among those with less than a high school diploma fell in July but performed much worse than others in May and June.
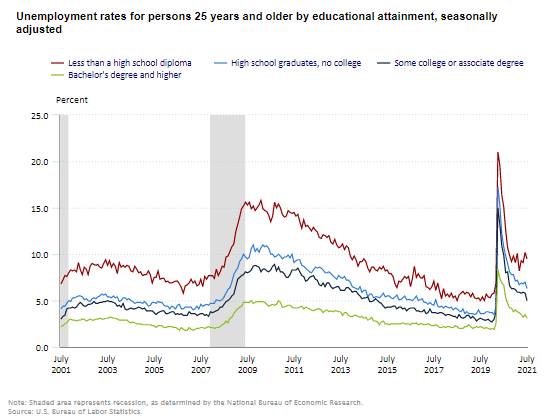
Note: The BLS has still not shaded the most recent recession on this chart.
Source: Bureau of Labor Statistics
Reasons for Unemployment – Layoff Status
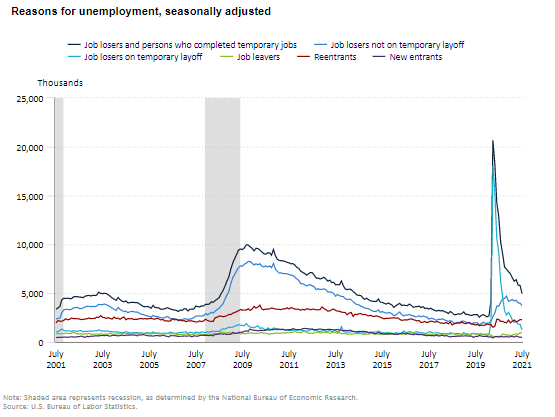
July saw a slight uptick in “Job Leavers” while most other categories fell. So people could be shifting from temporary jobs to better more permanent jobs.
Note: As in the previous chart, the BLS has not added a shaded region for the current recession which began in February 2020 according to NBER.
Source: BLS
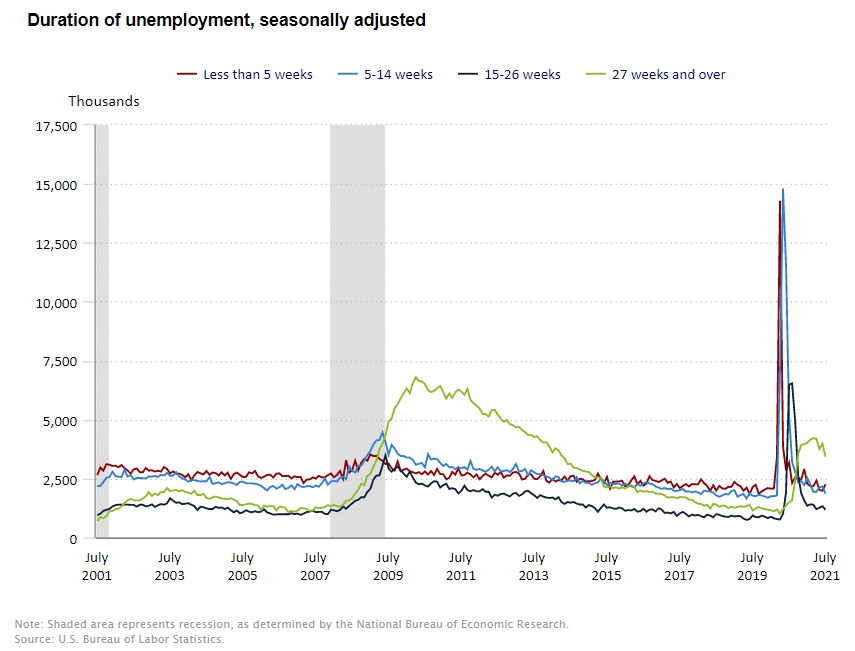
Duration of Unemployment
It appears that those who are “long-term unemployed” i.e. over 27 weeks dipped sharply in July, which is a positive indicator that people are getting back to work.
Labor Force Participation Rate
The Labor Force Participation Rate (LFPR) appears to be bouncing between 61.4% and 61.7%.
The Labor Force Participation Rate (LFPR) was 66.2% in January 2008, from there it fell fairly steadily (higher is better). Reaching 62.8% by October 2013, by March 2014 it had rallied a bit back to 63.2% but then it continued to fall. It bottomed at 62.4% in September 2015. From there, it made several attempts to rally above 63% but failed every time until January 2020 when it once again attained the 63.4% level and remained there in February. Unfortunately, the Coronavirus shutdown knocked it back all the way to 60.2% in April 2020. Since then it has rebounded as far as 61.7% in August and October 2020 and once again in April and July 2021. In January and February 2021 it fell to 61.4%.
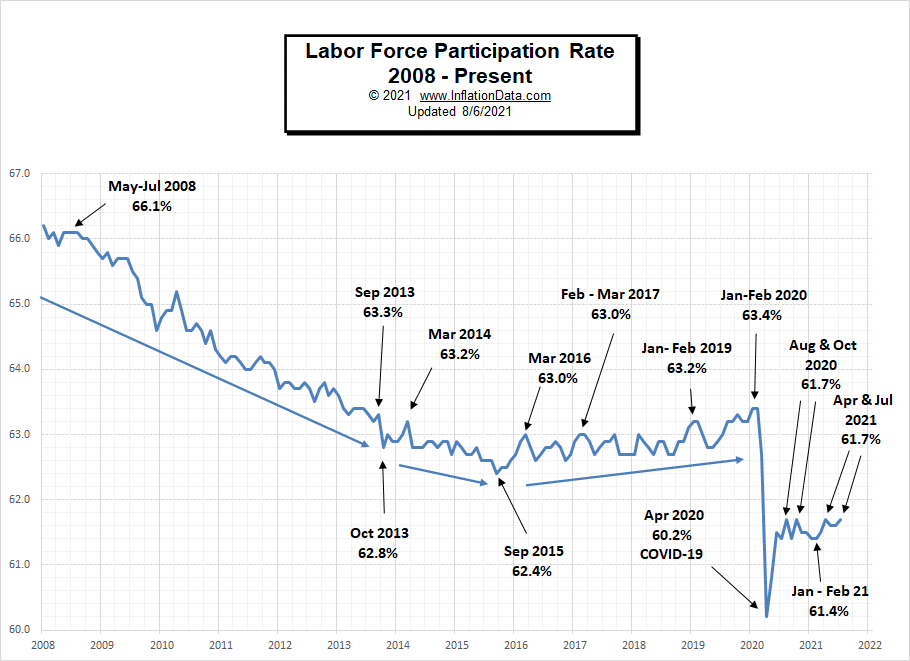
See Labor Force Participation Rate for more information.
If you would like to receive this monthly report and other article updates click here you can unsubscribe at any time.
Here are some articles you might enjoy in case you missed them:
Read more on UnemploymentData.com.
- Getting Cisco Certified to Improve Your Job Prospects
- Protect Your Business Against Lawsuits
- 4 Finance Jobs That Can Make a Great Career
- Creating a Personal Brand for Your Success
From InflationData.com
- How Can Inflation Affect Businesses?
- Inflation and Bonds
- June 2021: Highest Annual Inflation since 2008
- Oil vs. Gold- Why Compare Commodity Prices Against Each Other?
- How Does a Country “Export” its Inflation?
From Financial Trend Forecaster
- Moore Inflation Predictor
- NYSE ROC
- NASDAQ ROC
- Credit Card Debt Trends
- The Making of the Next Housing Crisis
- Which is Over Priced? Oil or Gold?
- What are NFTs and Why are They Going Crazy?
- Is Bitcoin Headed For a Fall?
- Why the Stock Market is the True “Great Deceiver”
- High “Beta” stocks … “Meme” stocks… and Index stocks… Oh My!
- Why U.S. Corporate Bankruptcies Could Skyrocket
- Why “Trouble is Brewing” for the U.S. Housing Market
- The Fear of Missing Out
From OptioMoney.com
- A Unique Way to Create Extra Income
- How Your Credit Score Affects You and Your Family
- Tips For Renting Out a Room In Your House
- How to Prepare to Apply for a Mortgage When You Are Self-Employed
- How to Minimize Complications When Reducing Your Mortgage
From Your Family Finances