
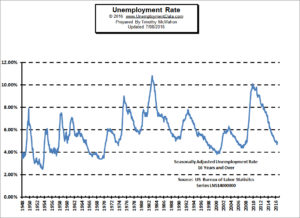
 On Friday July 8th, the U.S. Bureau of Labor Statistics (BLS) released their newest unemployment data for June 2016. According to the BLS, the current “Seasonally Adjusted” Unemployment Rate is 4.9% up from 4.7% for May. The current “Unadjusted” rate is 5.1% up from 4.5% in May.
In an interesting twist, although total non-farm payroll employment increased by 287,000 in June, the unemployment rate also rose to 4.9 percent from 4.7%.
How can employment and unemployment increase at the same time you may ask??? Read More …
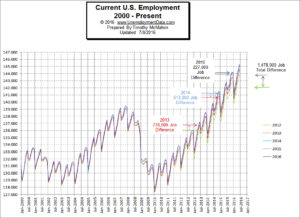 The number of Unadjusted jobs reported for June was 145.239 million up from January 2016’s 141.150 million. Employment is slightly above November 2015’s previous peak of 144.122 million.
According to David Stockman :
“… at the February 2008 peak prior to the crisis, the BLS reported 138.5 million nonfarm payroll jobs compared to 143.9 million in April 2016. The net gain is thus only 5.6 million, and it means nearly 9 million or 61% of the 14 million new jobs … are not “new” at all; they were born-again jobs, and even then they consist of lower paying and lesser quality jobs than the ones obliterated during the crash and so-called Great Recession.
For instance, there has been a loss of 2.3 million goods-producing jobs in manufacturing, mining/energy and construction, paying an average of$58,000 per year; and these have been swapped for 1.9 million jobs in leisure and hospitality paying less than $20,000 per year.” Read More …
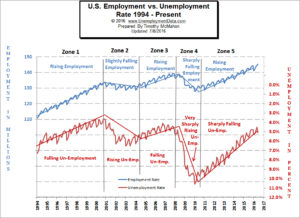 On the chart to the left we see the short-term picture of both sides of the employment equation employment vs unemployment. The blue line is employment and the red line is unemployment (inverted). We flipped the red line upside down so we can easily compare the two so they are both heading in the same direction.
We can see that in zone 5 the official unemployment rate stopped tracking the employment rate and decreased much more sharply than the employment rate justifies. This is primarily due to a falling labor force participation rate. Read More …
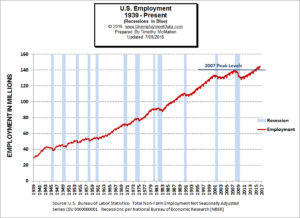 In this chart we can see the historical employment data from 1939 through the present. But in addition to the number of jobs we can also see the recessions shaded blue. We can also see that the number of jobs is barely above 2007 peak levels and when you take into consideration the 21.5 million person increase in population since 2007 you see that the “recovery” is actually quite anemic. Read More …
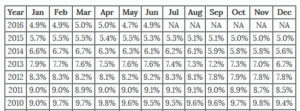
Unadjusted Unemployment Rates
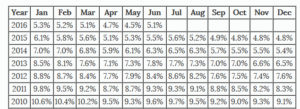
Read More ….
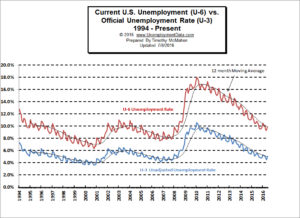
Current U-6 Unemployment Rate for June 2016 is: 9.9%
The Gallup equivalent to U-6 (they call the “Underemployment Rate”) is: 13.4%
Read More ….
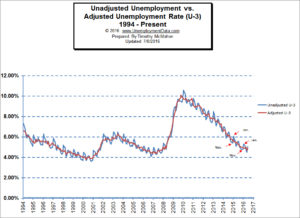
Unadjusted vs. Seasonally Adjusted Unemployment Rate
The Unadjusted U-3 was 4.5% in May down from 4.7% in April and the Seasonally Adjusted U-3 was 4.7% down from 5.0%. More …
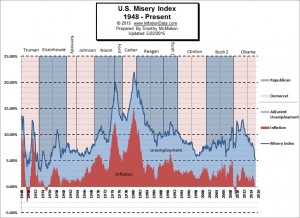
What is the Misery Index?
The misery index helps determine how the average citizen is doing economically and it is calculated by simply adding the Annual inflation rate to the Seasonally Adjusted unemployment rate. The misery index as of June 2016 (based on the most recent official government data for the 12 months ending in May) is at 5.72%.
Seasonally Adjusted Unemployment
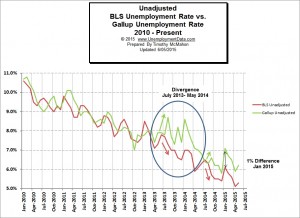
Whose Unemployment Numbers are Right?
Although up until recently the difference wasn’t massive it does appear that the BLS data is biased to the low side compared to the independently surveyed Gallup numbers. Like the previous two summers the gap between the BLS and the Gallup numbers closed for June 2016 with the BLS Unadjusted U-3 coming in at 5.1% and the Gallup numbers coming is at 5.4%. More …
Current U-6 Unemployment Rate is 9.9% (BLS) or 13.4% (Gallup)