• About WordPress
    • WordPress.org
    • Documentation
    • Learn WordPress
    • Support
    • Feedback
  • Log In
  • Skip to primary navigation
  • Skip to main content
  • Skip to primary sidebar
  • Home
  • Contact us
  • Related Sites
    • InflationData.com
    • Financial Trend Forecaster
    • Your Family Finances
    • Elliott Wave University
    • Optio Money
  • About
    • Terms of Use
    • Disclaimer & Disclosure
    • Privacy Statement
  • Sitemap
    • 2009-2010 Posts
    • 2011 Posts

UnemploymentData.com

Your Source for Employment and Unemployment Data

Unemployment
  • Charts
    • Current Unemployment Rate Chart
    • Current Employment Rate (Chart and Data)
    • Current Employment vs Unemployment Chart
    • Historical Employment Data
    • Employment Population Ratio
    • Misery Index
  • Unemployment
    • Historical Unemployment Rate Tables
    • What Is U-6 Unemployment?
    • Unadjusted vs. Seasonally Adjusted U-3 Unemployment Rate
    • BLS vs. Gallup Unemployment Numbers
    • Current U-6 Unemployment Rate
    • What is the Labor Force Participation Rate?
    • What is the Real Unemployment Rate?
  • Employment
    • Current Employment Rate (Chart and Data)
    • Historical Employment Data
    • Contacting a Live Person at the State Employment Commission
      • How to Talk to a Live Person at the Virginia Unemployment Commission
      • Florida’s FLUID Unemployment Program
    • Benefits
      • Insurance
      • Retirement
    • Careers
    • Employment Costs
    • Experience
    • Government
    • Job Hunting
      • Interview
      • Resume
  • Find Articles
  • Education
    • Skills
  • General
    • Small Business
      • Outsourcing
    • Success
You are here: Home / Unemployment / BLS Releases July Unemployment: 6.2% Up from 6.1% in June

BLS Releases July Unemployment: 6.2% Up from 6.1% in June

August 1, 2014 by Tim McMahon

The U.S. Bureau of Labor Statistics (BLS) released the July Unemployment figures on August 1st. The Seasonally Adjusted Unemployment Rate was 6.2% up from 6.1% in June. The Unadjusted Unemployment rate was also up from 6.3% in June to 6.5% July. Of course the spin-doctors at the BLS said it was “virtually unchanged”.

BLS vs Gallup Unemployment Numbers
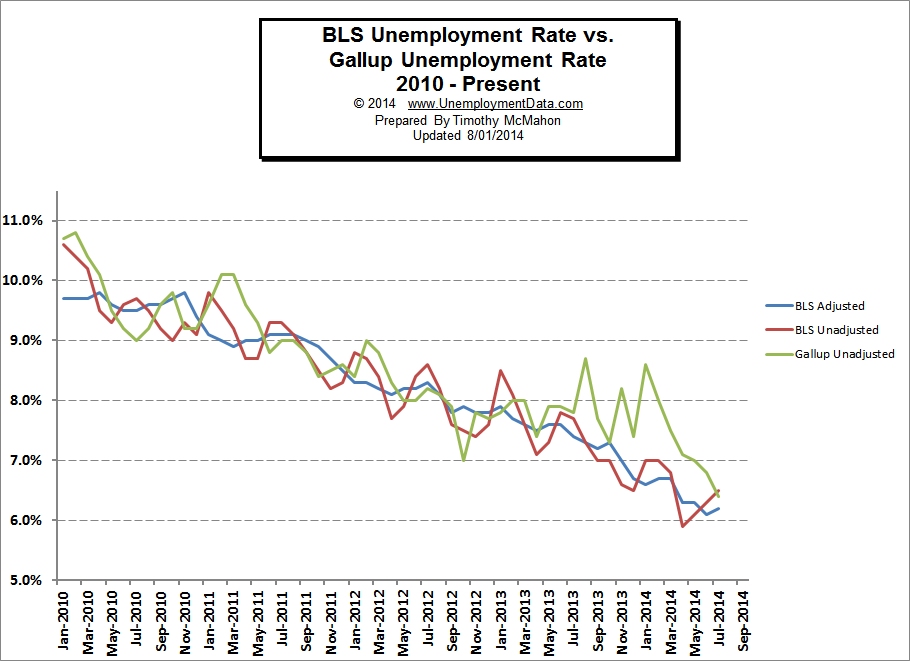
In a surprising turn of events, the unadjusted BLS numbers actually agree with the Gallup numbers with the rare occurrence that the BLS numbers are actually higher than the Gallup numbers for the first time in 17 months.

Of course, we shouldn’t get too excited because the “adjusted numbers” are still a bit on the low side and the smoke and mirrors coming out of the BLS have simply shifted to the Employment numbers.

Employment Numbers

According to the commissioner of the Bureau of Labor Statistics monthly report, “Total non-farm payroll employment increased by 209,000 in July, the same as its average monthly gain over the prior 12 months. In July, employment grew in professional and business services, manufacturing, retail trade, and construction.”

So we might begin to wonder if Employment went up, how did unemployment also go up? Of course, the commissioner downplayed that by saying it was “virtually unchanged”. But when we look at the Unadjusted employment number the 209,000 jobs mysteriously vanish and we are left with a steaming crater.  Somehow, the unadjusted numbers show a loss of a whopping 1 MILLION 100 THOUSAND jobs!

Here is a screenshot from the BLS’ own data (data is in thousands):

Employment Numbers july 2014
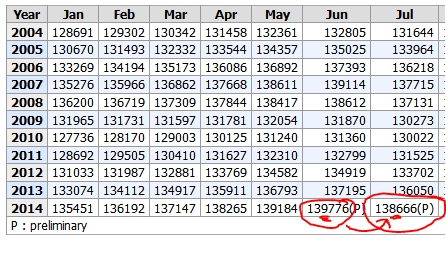
Yes, it says June had 139.776 million jobs and July had 138.666 million. Last time I checked 138 million was less than 139 million. Must be that new “common core” math.  Check for yourself… Source: http://data.bls.gov/timeseries/CEU0000000001

Of course, since it seems to happen every year at this time they can “seasonally adjust it away”  and say we gained jobs because we didn’t lose as much as an average year. But I would guess that the million people who lost their jobs might not look at it that way. And that doesn’t explain why the “Seasonally Adjusted” Unemployment rate still went up.

According to the BLS the U-6 unemployment rate for July was 12.6% up from 11.7% in May and 12.4% in June. But Gallup says that the situation is actually much worse than that and their equivalent of the U-6 rate is at 15.1% but it is down significantly from May when it was 16.4%. See BLS vs Gallup Numbers.

Payroll to Population Rate

The payroll to population rate looks at a slightly different metric than the unemployment rate although at first blush it sounds similar. While the unemployment rate looks at  the percentage of the “workforce” that can’t find a job (and a fairly narrow definition of the term workforce at that). Gallup’s Payroll to Population rate (P2P) looks at the percentage of the total population that is working. This number, in my opinion, is much less subject to fudging since although you can redefine the term “workforce” as evidenced by the various unemployment rates (U1 through U-6) it is much more difficult to redefine the total population of the United States.

Unlike the unemployment rate where a lower number is better, in the P2P, a higher number is better in that it indicates a greater percentage of the population is working. In July, Gallup’s P2P was 45.1% up from June’s 45.0%.

See Also:

  • Current Employment Data
  • Historical Employment Data Chart
  • U-6 Unemployment Rate
  • Unemployment Rate Chart
  • Seasonally Adjusted Unemployment Rate in Table form
  • Misery Index

Filed Under: Unemployment Tagged With: employment, unemployment

About Tim McMahon

Work by editor and author, Tim McMahon, has been featured in Bloomberg, CBS News, Wall Street Journal, Christian Science Monitor, Forbes, Washington Post, Drudge Report, The Atlantic, Business Insider, American Thinker, Lew Rockwell, Huffington Post, Rolling Stone, Oakland Press, Free Republic, Education World, Realty Trac, Reason, Coin News, and Council for Economic Education. Connect with Tim on Google+

Primary Sidebar

Search Site

Sponsored:

URGENT: These Stocks Stand Poised to Benefit from President Trump's Trade Wars!

As the Trump administration moves ahead with aggressive tariff policies on key imports, the mainstream media is scrambling.

This Free Report - which you can download now - reveals the names and ticker symbols of 5 Stock Poised to Benefit Most from President Trump's Tariff Wars.

Click Here to Download Your FREE Stock Report Now.

Recent Posts

  • April 2025 Employment / Unemployment Report
  • Would More Jobs Help Social Security?
  • March 2025- Employment / Unemployment Report
  • February 2025 Jobs Report
  • January 2025 BLS Employment Report

Resources

  • Bureau of Labor Statistics Current Population Survey Monthly survey of households conducted by the Bureau of Census for BLS. It provides data on the labor force, employment, unemployment, etc.
  • Capital Professional Services Providing web design and development and Internet marketing services
  • Elliott Wave University Using the Elliott Wave Principle to improve investment performance
  • Financial Trend Forecaster Featuring Moore Inflation Predictor, NYSE Rate of Change and NASDAQ Rate of change
  • InflationData.com Inflation calculators, databases, etc.
  • Intergalactic Web Designers Web design and development services
  • Your Family Finances

Articles by Category

Articles by Date

Disclaimer

At UnemploymentData.com we are not registered investment advisors and do not provide any individualized advice. Past performance is not necessarily indicative of future performance and future accuracy and profitable results cannot be guaranteed.

Privacy & Terms of Use

Privacy Statement & Terms of Use

Do Not Sell My Information

Copyright © 2025 · News Pro on Capital Professional Services, LLC. All rights reserved · Log in