The U.S. Bureau of Labor Statistics (BLS) released the February Unemployment figures on Friday March 6th. According to the BLS the Current Unemployment Rate (Seasonally adjusted) for February was 5.5% down from 5.7% in January. Along the same lines we see the Unadjusted Unemployment rates fall from 6.1% to 5.8%. However, according to Gallup the Unadjusted Unemployment rate was actually 6.7% and the U-6 unemployment rate was 16.1%.
Unemployment Numbers According to Gallup
| Unadjusted U-3 | Unadjusted U-6 |
|
| BLS | 5.8% | 11.4% |
| Gallup | 6.7% | 16.1% |
| Difference | 0.9% | 4.7% |
Once again the BLS numbers are quite a bit different than the independently generated Gallup numbers. This is no surprise, based on the long-term comparison between the BLS numbers and the Gallup numbers the BLS numbers consistently present a rosier picture than the Gallup numbers do. Theoretically the numbers are slightly different with Gallup measuring unemployment for those 18 and older while the BLS measures from 16 and older. But with the high unemployment rate of 16-18 year olds, this should actually make the BLS numbers higher than the Gallup numbers not lower, so it makes the understatement by the BLS even worse.


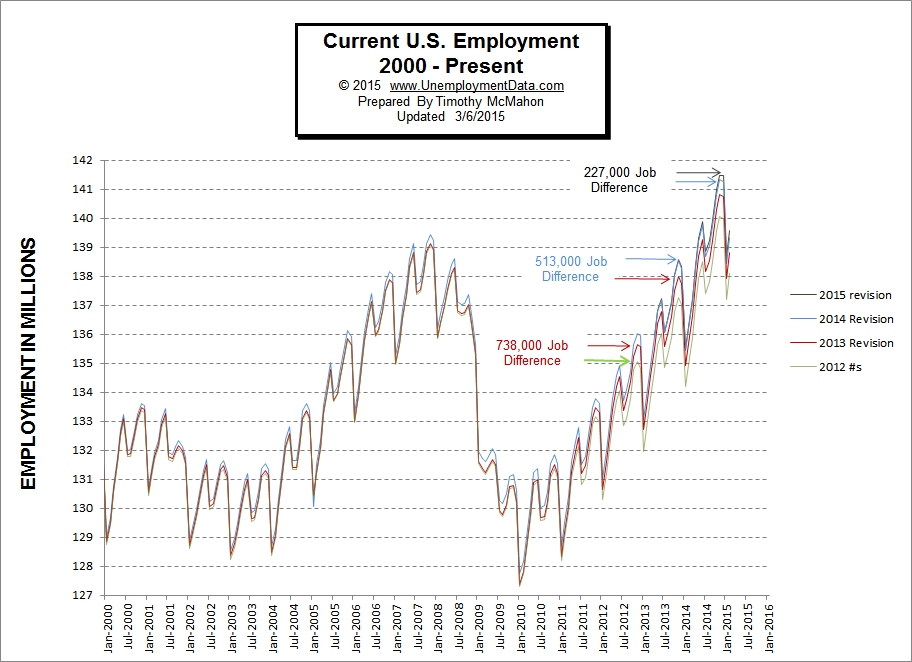
This chart shows the actual number (unadjusted) of Non-farm jobs in the United States as tracked by the U.S. Bureau of Labor statistics. Historical Employment Data Series CEU 0000000001.
