NOTE: Gallup has STOPPED publishing their Unemployment Numbers effective in July 2017. This includes U-3, Underemployment (U-6), and Good Jobs Index (Payroll to Population Rate).
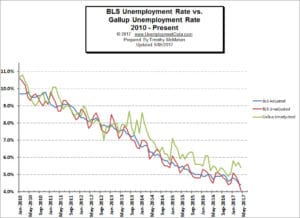
From 2010-2017, the Gallup Survey people both generated numbers to help us understand the employment/unemployment situation. Unfortunately, they often presented a different picture from the numbers generated by the U.S. Bureau of Labor Statistics. Typically the BLS data presented a rosier picture than the independently surveyed Gallup numbers.
Often in the summer, the gap between the BLS and the Gallup closed. In July 2016, the BLS and the Gallup numbers came in identical. Early in 2017 the gap widened to 1.3% in April but has narrowed again to 0.6% in June.
For June 2017 Gallup said unadjusted U-3 unemployment was 5.1% down from 5.2% in May and 5.4% in April while the BLS said it was 4.5% up from 4.1% in May and April. So the spread is currently 0.6%.
Whose Unemployment Numbers are Right?

We’ve looked at Employment vs. Unemployment on other pages to see how they compare and we’ve looked at U-6 (total labor force including those who’ve given up looking) vs. U-3 (those who are still actively looking). The U-3 unemployment rate is the commonly quoted one. But the one problem is that all that data comes from the government. If they are fudging the numbers how would we know? Unless as we’ve noted before there are inconsistencies between the Unemployment and Employment Charts. But we [Read more…] about Comparing Bureau of Labor Statistics Unemployment Numbers to an Independent Source
