
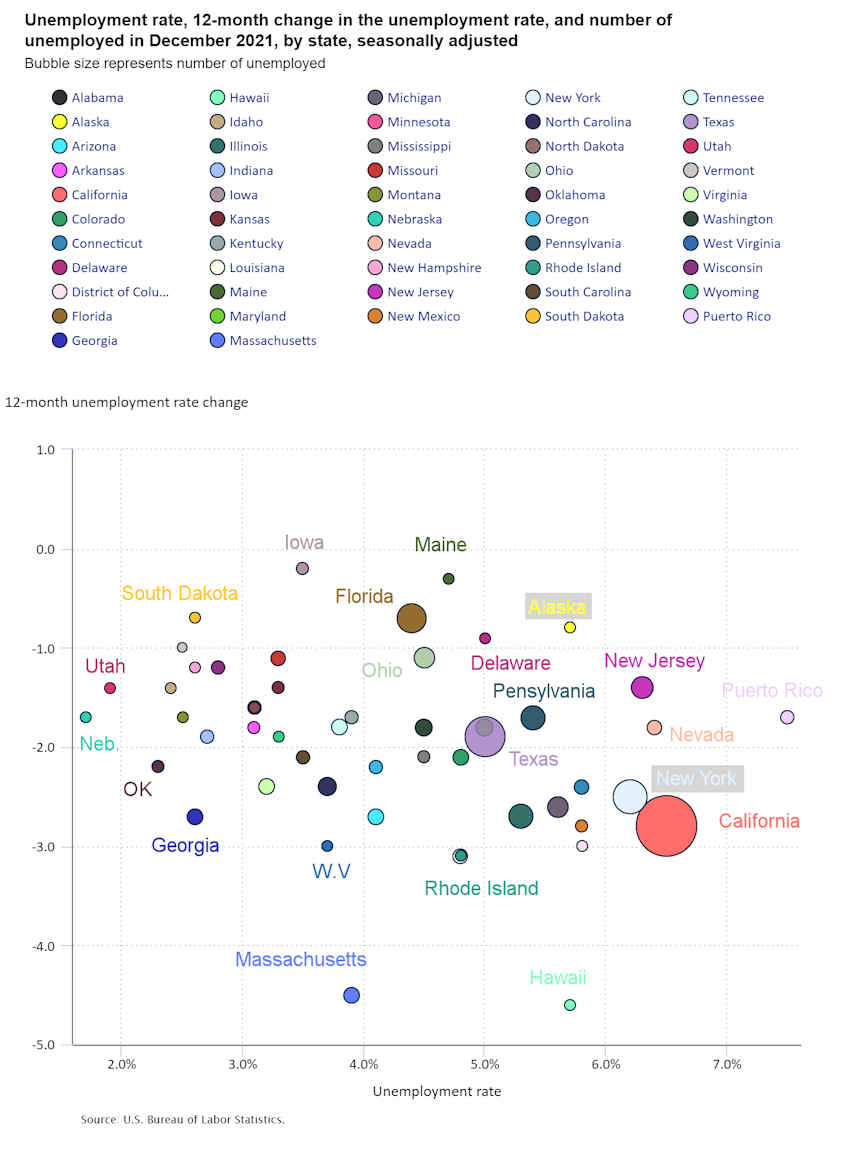
Unemployment rates fell in 42 states plus the District of Columbia from the previous month. Forty-Eight states along with D.C. had significantly lower unemployment rates than year-ago levels. Iowa and Maine’s unemployment rates have only fallen by -0.2% and -0.3% respectively.
California had the highest number of unemployed individuals at 1.238 million which gave them a 6.5% unemployment rate. The next highest number of unemployed was Texas with 712,828 unemployed and a 5.0% unemployment rate. Puerto Rico had the highest unemployment rate at 7.5%. And Nebraska had the lowest unemployment rate at 1.7%.
In the following chart, bubble size indicates the number of unemployed. The vertical axis indicates the percent change from a year ago, while the horizontal axis indicates the current unemployment rate (in percent).
| State | Unemployment Rate | 12-month % Change | Number of Unemployed |
| Alabama | 3.1 | -1.6 | 69,854 |
| Alaska | 5.7 | -0.8 | 20,233 |
| Arizona | 4.1 | -2.7 | 150,043 |
| Arkansas | 3.1 | -1.8 | 42,609 |
| California | 6.5 | -2.8 | 1,238,037 |
| Colorado | 4.8 | -2.1 | 154,292 |
| Connecticut | 5.8 | -2.4 | 105,215 |
| Delaware | 5.0 | -0.9 | 24,609 |
| District of Columbia | 5.8 | -3.0 | 23,741 |
| Florida | 4.4 | -0.7 | 466,176 |
| Georgia | 2.6 | -2.7 | 135,906 |
| Hawaii | 5.7 | -4.6 | 37,057 |
| Idaho | 2.4 | -1.4 | 22,088 |
| Illinois | 5.3 | -2.7 | 333,136 |
| Indiana | 2.7 | -1.9 | 88,240 |
| Iowa | 3.5 | -0.2 | 57,907 |
| Kansas | 3.3 | -1.4 | 49,796 |
| Kentucky | 3.9 | -1.7 | 78,817 |
| Louisiana | 4.8 | -3.1 | 98,295 |
| Maine | 4.7 | -0.3 | 31,806 |
| Maryland | 5.0 | -1.8 | 156,473 |
| Massachusetts | 3.9 | -4.5 | 145,093 |
| Michigan | 5.6 | -2.6 | 265,115 |
| Minnesota | 3.1 | -1.6 | 93,906 |
| Mississippi | 4.5 | -2.1 | 56,792 |
| Missouri | 3.3 | -1.1 | 101,988 |
| Montana | 2.5 | -1.7 | 13,689 |
| Nebraska | 1.7 | -1.7 | 17,128 |
| Nevada | 6.4 | -1.8 | 99,409 |
| New Hampshire | 2.6 | -1.2 | 19,561 |
| New Jersey | 6.3 | -1.4 | 280,211 |
| New Mexico | 5.8 | -2.8 | 55,640 |
| New York | 6.2 | -2.5 | 572,626 |
| North Carolina | 3.7 | -2.4 | 188,391 |
| North Dakota | 3.1 | -1.6 | 12,297 |
| Ohio | 4.5 | -1.1 | 256,392 |
| Oklahoma | 2.3 | -2.2 | 42,758 |
| Oregon | 4.1 | -2.2 | 89,349 |
| Pennsylvania | 5.4 | -1.7 | 337,133 |
| Rhode Island | 4.8 | -3.1 | 26,684 |
| South Carolina | 3.5 | -2.1 | 85,090 |
| South Dakota | 2.6 | -0.7 | 12,173 |
| Tennessee | 3.8 | -1.8 | 127,341 |
| Texas | 5.0 | -1.9 | 712,828 |
| Utah | 1.9 | -1.4 | 31,817 |
| Vermont | 2.5 | -1.0 | 7,972 |
| Virginia | 3.2 | -2.4 | 136,557 |
| Washington | 4.5 | -1.8 | 176,857 |
| West Virginia | 3.7 | -3.0 | 28,903 |
| Wisconsin | 2.8 | -1.2 | 86,197 |
| Wyoming | 3.3 | -1.9 | 9,717 |
| Puerto Rico | 7.5 | -1.7 | 82,653 |
Nebraska had the lowest jobless rate in December, at 1.7 percent, followed by Utah, 1.9 percent. The rates in the following 12 states set new series lows (since 1976): Arkansas (3.1 percent), Georgia (2.6 percent), Idaho (2.4 percent), Indiana (2.7 percent), Kentucky (3.9 percent), Mississippi (4.5 percent), Montana (2.5 percent), Nebraska (1.7 percent), Oklahoma (2.3 percent), Utah (1.9 percent), West Virginia (3.7 percent), and Wisconsin (2.8 percent). California and Nevada had the highest unemployment rates, 6.5 percent, and 6.4 percent, respectively.
Editor’s Note: It is possible that part of the reason that the unemployment rate is so low is that people have withdrawn from the workforce due to COVID fears, homeschooling, or other reasons.
In total, 17 states and the District of Columbia had unemployment rates higher than the U.S. figure of 3.9 percent, 16 states had lower rates, and 17 states had rates that were not appreciably different from that of the nation.
Nonfarm Payroll Employment
Nonfarm payroll employment increased in 17 states and was essentially unchanged in 33 states and the District of Columbia in December 2021. The largest job gains occurred in California (+50,700), Texas (+50,000), and New York (+45,300). The largest percentage increases occurred in Iowa and West Virginia (+0.8 percent each), followed by Massachusetts, Missouri, and Montana (+0.6 percent each).
Over the year, nonfarm payroll employment increased in 48 states and the District of Columbia and was essentially unchanged in 2 states. The largest job increases occurred in California (+954,400), Texas (+694,400), and Florida (+479,300). The largest percentage increases occurred in Nevada (+7.4 percent), Hawaii (+7.1 percent), and Massachusetts (+6.6 percent).