• About WordPress
    • WordPress.org
    • Documentation
    • Learn WordPress
    • Support
    • Feedback
  • Log In
  • Skip to primary navigation
  • Skip to main content
  • Skip to primary sidebar
  • Home
  • Contact us
  • Related Sites
    • InflationData.com
    • Financial Trend Forecaster
    • Your Family Finances
    • Elliott Wave University
    • Optio Money
  • About
    • Terms of Use
    • Disclaimer & Disclosure
    • Privacy Statement
  • Sitemap
    • 2009-2010 Posts
    • 2011 Posts

UnemploymentData.com

Your Source for Employment and Unemployment Data

Unemployment
  • Charts
    • Current Unemployment Rate Chart
    • Current Employment Rate (Chart and Data)
    • Current Employment vs Unemployment Chart
    • Historical Employment Data
    • Employment Population Ratio
    • Misery Index
  • Unemployment
    • Historical Unemployment Rate Tables
    • What Is U-6 Unemployment?
    • Unadjusted vs. Seasonally Adjusted U-3 Unemployment Rate
    • BLS vs. Gallup Unemployment Numbers
    • Current U-6 Unemployment Rate
    • What is the Labor Force Participation Rate?
    • What is the Real Unemployment Rate?
  • Employment
    • Current Employment Rate (Chart and Data)
    • Historical Employment Data
    • Contacting a Live Person at the State Employment Commission
      • How to Talk to a Live Person at the Virginia Unemployment Commission
      • Florida’s FLUID Unemployment Program
    • Benefits
      • Insurance
      • Retirement
    • Careers
    • Employment Costs
    • Experience
    • Government
    • Job Hunting
      • Interview
      • Resume
  • Find Articles
  • Education
    • Skills
  • General
    • Small Business
      • Outsourcing
    • Success
You are here: Home / Archives for Alaska

Alaska

Arkansas, California, Idaho, South Carolina, Texas and Washington Set New Unemployment Lows in September

October 20, 2018 by Tim McMahon

The U.S. Bureau of Labor Statistics reported on Unemployment rates by state on Friday October 19th. Seasonally adjusted unemployment rates for September fell over the previous month in 9 states, were higher in 4 states, and stable in 37 states and the District of Columbia.

Nonfarm payroll employment increased in 1 state, decreased in 9 states, and was stable in 37 states and D.C.

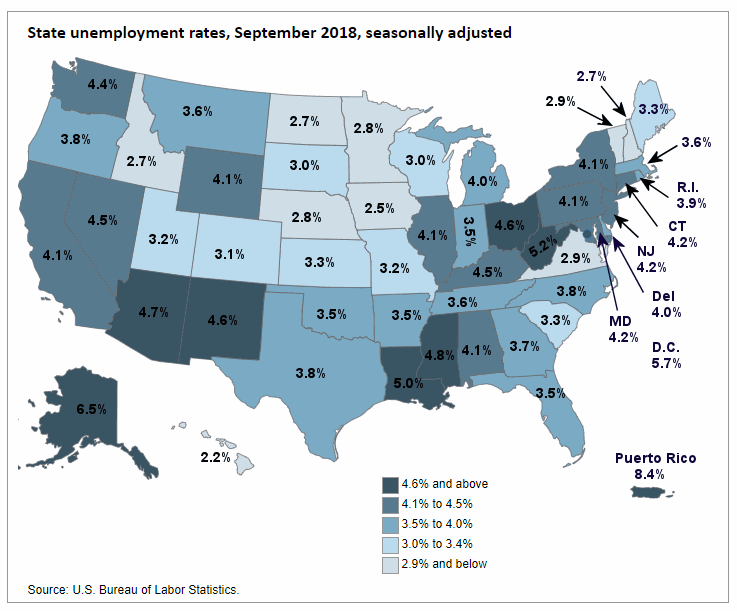
In the following map we can see the states with the lowest unemployment are light colored while the higher unemployment states are darker colored.


Unemployment by State Sept 2018

Unemployment

Arkansas, California, Idaho, South Carolina, Texas and Washington Set New Series Lows

Hawaii had the lowest seasonally adjusted unemployment rate in September, at 2.2%. Arkansas (3.5%), California (4.1%), Idaho (2.7%), South Carolina (3.3%), Texas (3.8%), and Washington (4.4%)  set a new series low since tracking began in 1976. At 6.5% Alaska had the highest jobless rate, not counting Puerto Rico’s 8.4% which is down 2.2% from year ago levels. In total, 13 states had unemployment rates lower than the U.S. figure of 3.7 percent, 12 states plus the District of Columbia and Puerto Rico had higher rates, and 25 states had [Read more…] about Arkansas, California, Idaho, South Carolina, Texas and Washington Set New Unemployment Lows in September

Filed Under: BLS Tagged With: Alaska, Arkansas, California, Florida, Idaho, Oklahoma, South Carolina, State, Texas, unemployment, Washington

High Unemployment Rates in Alaska and D.C.

July 29, 2017 by Tim McMahon

What Causes a State to Have a Lower Unemployment Rate?

Nationwide according to the U.S. Bureau of Labor Statistics the Seasonally Adjusted Unemployment rate is 4.4% but when you look a bit closer you will see that there is quite a bit of variation by state.

States with the Highest Unemployment Rates

Alaska had the highest jobless rate, at 6.8%, followed by New Mexico, at 6.4% and Washington D.C. at 6.2%.

22% of Alaskan Natives live below the poverty level.

Some of Alaska’s problems are understandable. Alaska has high transportation costs, little industry, a massively spread out population and massive poverty. As a matter of fact among Alaskan Native Americans the poverty rate is double the U.S. Average. The alcoholism mortality rate is 6 times higher than the national average. Obesity and diabetes rates are much higher and injury related deaths are much more frequent. But the situation among Native American tribes in Alaska is actually much worse than the statistics show.

Domestic violence is rampant among Native Americans in Alaska and not just in the home. I spoke with a teacher at a Native American School and they found it necessary to create two distinct schools to separate the boys from the girls because the girls were consistently being raped in the bathrooms. These rapes were routinely unreported to authorities because of the prevailing feeling that nothing would be done about it. And despite the massive under-reporting, statistics still show much higher rates of domestic violence than the average.

Opposite Conditions, Similar Rates

Looking at the various unemployment rates in the states, Alaska’s problems seem obvious but upon closer examination one begins to wonder. The third highest unemployment rate is Washington D.C. which is almost a polar opposite to all the factors in Alaska. D.C. is small, densely populated, has unlimited infrastructure, no oil reserves but it can draw funds from the entire country and it still has a surprisingly high unemployment rate at 6.2%. So two polar opposite places have similar unemployment rates. 

Similar Conditions, Different Rates

So let’s look at it the other way around and look at [Read more…] about High Unemployment Rates in Alaska and D.C.

Filed Under: General Tagged With: Alaska, Colorado, Connecticut, D.C., New Hampshire, North Dakota, Pot, Rhode Island, state unemployment rates, Vermont

Primary Sidebar

Search Site

Sponsored:

URGENT: These Stocks Stand Poised to Benefit from President Trump's Trade Wars!

As the Trump administration moves ahead with aggressive tariff policies on key imports, the mainstream media is scrambling.

This Free Report - which you can download now - reveals the names and ticker symbols of 5 Stock Poised to Benefit Most from President Trump's Tariff Wars.

Click Here to Download Your FREE Stock Report Now.

Recent Posts

  • April 2025 Employment / Unemployment Report
  • Would More Jobs Help Social Security?
  • March 2025- Employment / Unemployment Report
  • February 2025 Jobs Report
  • January 2025 BLS Employment Report

Resources

  • Bureau of Labor Statistics Current Population Survey Monthly survey of households conducted by the Bureau of Census for BLS. It provides data on the labor force, employment, unemployment, etc.
  • Capital Professional Services Providing web design and development and Internet marketing services
  • Elliott Wave University Using the Elliott Wave Principle to improve investment performance
  • Financial Trend Forecaster Featuring Moore Inflation Predictor, NYSE Rate of Change and NASDAQ Rate of change
  • InflationData.com Inflation calculators, databases, etc.
  • Intergalactic Web Designers Web design and development services
  • Your Family Finances

Articles by Category

Articles by Date

Disclaimer

At UnemploymentData.com we are not registered investment advisors and do not provide any individualized advice. Past performance is not necessarily indicative of future performance and future accuracy and profitable results cannot be guaranteed.

Privacy & Terms of Use

Privacy Statement & Terms of Use

Do Not Sell My Information

Copyright © 2025 · News Pro on Capital Professional Services, LLC. All rights reserved · Log in