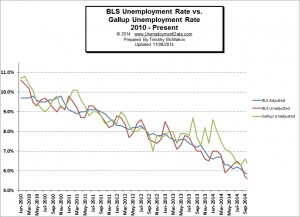
The U.S. Bureau of Labor Statistics (BLS) released the October Unemployment figures on November 7th. The Seasonally Adjusted Unemployment Rate was 5.8% down from 5.9% in September. The Unadjusted Unemployment rate was also down from 5.7% in September to 5.5% in October but traditionally October has one of the highest employment (lowest unemployment) levels of the year.

Gallup says the unadjusted Unemployment rate is 6.2% while the BLS says it is only 5.5% for a 0.7% difference. That is a 12.7% margin of error. Notice the major divergence at the end of the chart.
According to the commissioner of the Bureau of Labor Statistics monthly report, “Total nonfarm payroll employment rose by 214,000 in October, and the unemployment rate edged down to 5.8 percent. Employment increased in food services and drinking places, retail trade, and health care.“
The BLS says the broader U-6 unemployment fell from 11.3% in in September to 11.1% in October while Gallup says that it is actually 14.8% a difference of 3.7% or a 33.3% margin of error.
Many people consider the U-6 unemployment rate to be the “real” unemployment rate because it includes “discouraged workers” i.e. those who would like to work but have given up looking because they don’t feel there are any jobs available for them. See What is U-6 Unemployment? for more information.
Payroll to Population Rate
The payroll to population rate looks at a slightly different metric than the unemployment rate although at first blush it sounds similar. While the unemployment rate looks at the percentage of the “workforce” that can’t find a job (and a fairly narrow definition of the term workforce at that). Gallup’s Payroll to Population rate (P2P) looks at the percentage of the total population that is working. This number, in my opinion, is much less subject to fudging since although you can redefine the term “workforce” as evidenced by the various unemployment rates (U1 through U-6) it is much more difficult to redefine the total population of the United States.
Unlike the unemployment rate where a lower number is better, in the P2P, a higher number is better in that it indicates a greater percentage of the population is working. In September, Gallup’s P2P was 44.8% down from June’s 45.0%, July’s 45.1% and August’s 44.9% . In October the P2P had retreated to 44.4% which is still better than November 2013’s 42.9% but worse than October 2013’s 45.7%.
See Also:
