
The U.S. Bureau of Labor Statistics (BLS) released the November Unemployment figures on December 5th. The Seasonally Adjusted Unemployment Rate was 5.8% the same as the October. The Unadjusted Unemployment rate was also flat at 5.5% for November.
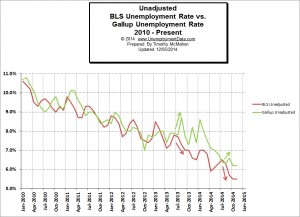 Once again the BLS numbers are quite a bit different than the independently generated Gallup numbers. This is no surprise, based on the long-term comparison between the BLS numbers and the Gallup numbers the BLS numbers consistently present a rosier picture than the Gallup numbers do.
According to surveys by the Gallup organization Unadjusted Unemployment for November was 6.2% which is significantly higher than the 5.5% reported by the BLS.
| Unadjusted U-3 | Unadjusted U-6 |
|
| BLS | 5.5% | 11.0% |
| Gallup | 6.2% | 15.1% |
| Difference | 0.7% | 4.1% |
See Is the Government Fudging Unemployment Numbers? for the comparison of Gallup numbers vs. Bureau of Labor Statistics numbers.
Employment:
Employment for November was 141.301 million.
Overall, seasonally adjusted total non-farm payroll employment increased by 321,000 in November. With the ramp up in employment for the “Black Friday” and Christmas season in the retail sector, employment in retail trade rose by 50,000 in November compared with an average gain of 22,000 per month over the prior 12 months. While Health care added 29,000 jobs, manufacturing added 28,000 jobs, financial activities added 20,000 jobs and Transportation and warehousing employment increased by 17,000 over the month.
During the same period the Civilian non-institutional population increased by 187,000 so employment increased much faster than the population. But we must remember that November is generally the highest employment month of the year so we can expect some decline over the next few months.
For more information see: Current Unemployment Rate Chart
| Year | Jan | Feb | Mar | Apr | May | Jun | Jul | Aug | Sep | Oct | Nov | Dec |
| 2014 | 6.6% | 6.7% | 6.7% | 6.3% | 6.3% | 6.1% | 6.2% | 6.1% | 5.9% | 5.8% | 5.8% | NA |
| 2013 | 7.9% | 7.7% | 7.6% | 7.5% | 7.6% | 7.6% | 7.4% | 7.3% | 7.2% | 7.3% | 7.0% | 6.7% |
| 2012 | 8.3% | 8.3% | 8.2% | 8.1% | 8.2% | 8.2% | 8.3% | 8.1% | 7.8% | 7.9% | 7.8% | 7.8% |
| 2011 | 9.0% | 9.0% | 8.9% | 9.0% | 9.0% | 9.1% | 9.1% | 9.1% | 9.0% | 8.9% | 8.7% | 8.5% |
| 2010 | 9.0% | 9.7% | 9.7% | 9.8% | 9.6% | 9.5% | 9.5% | 9.6% | 9.6% | 9.7% | 9.8% | 9.4% |
| 2009 | 7.0% | 8.2% | 8.6% | 8.9% | 9.4% | 9.5% | 9.5% | 9.7% | 9.8% | 10.1% | 9.9% | 9.9% |
| 2008 | 500% | 4.8% | 5.1% | 4.9% | 5.4% | 5.6% | 5.8% | 6.1% | 6.2% | 6.6% | 6.8% | 7.3% |
| 2007 | 4.0% | 4.5% | 4.4% | 4.5% | 4.4% | 4.6% | 4.7% | 4.6% | 4.7% | 4.7% | 4.7% | 5.0% |
For data back to 1948 See: Unemployment Rate
Historical Employment Data: How Many People are Employed?
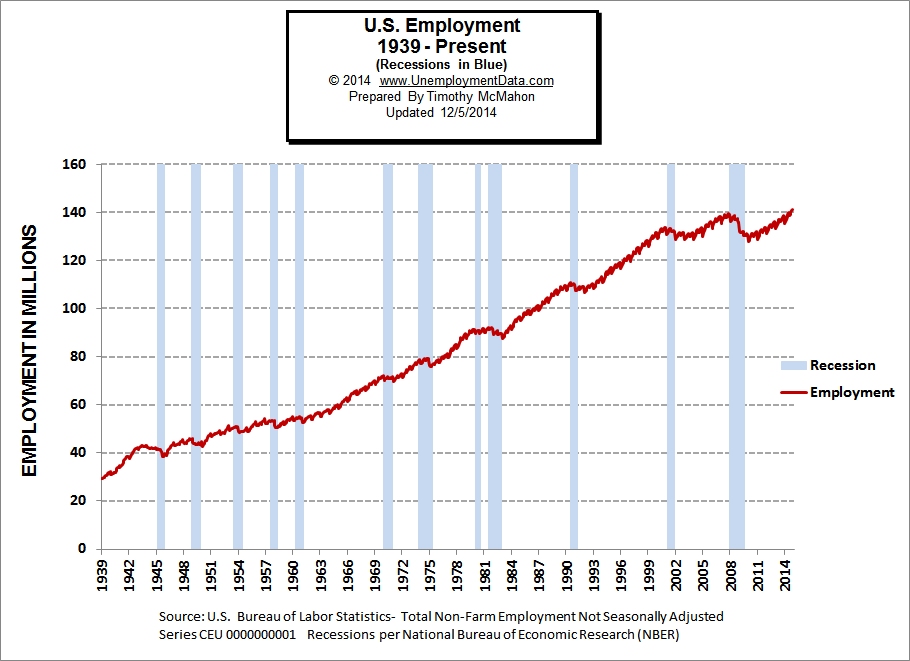 One thing we can see from the chart is that the recent employment drop was one of the steepest declines since 1939 and had one of the longest duration recessions during that period.
For more Information See:
Current Unemployment Rate Chart
The Misery index measures inflation plus unemployment and is a good measure of the discomfort of the country’s population.
Current Employment vs Unemployment Chart Not just two sides of the same coin.