
![]() The U.S. Bureau of Labor Statistics (BLS) released its monthly unemployment survey results for July on August 2nd. Unemployment is still near record lows but this month’s Unemployment report was a bit of a “mixed bag” with some positive news and some not quite so positive.
The U.S. Bureau of Labor Statistics (BLS) released its monthly unemployment survey results for July on August 2nd. Unemployment is still near record lows but this month’s Unemployment report was a bit of a “mixed bag” with some positive news and some not quite so positive.
According to the Commissioner of the U.S. Bureau of Labor Statistics:
“Nonfarm payroll employment increased by 164,000 in July, and the unemployment rate was unchanged at 3.7 percent. Notable job gains occurred in professional and technical services, health care, social assistance, and financial activities.
The July increase in payroll employment was in line with the average monthly job gain in the first half of the year (+165,000), but below the average monthly job gain of 223,000 for 2018. (Incorporating revisions for May and June, which decreased employment by 41,000, monthly job gains have averaged 140,000 over the past 3 months.) ”
Of course he is talking about “Seasonally Adjusted Jobs” in reality there were 152.307 million people employed according to the BLS’ June report and then they adjusted it down to 152.242 million but in July there are only 151.183 million employed so there was either a decrease of -1.059 million jobs based on the new numbers or a decrease of -1.124 million based on the original numbers. But there were only 148.295 million employed in January so there about 2.88 million more people employed in July than in January.
For more info see our Current Unemployment Chart and Current U.S. Employment Chart commentary:
Key July Employment and Unemployment Numbers
- Adjusted U-3 Unemployment- 3.7% Unchanged from June
- Unadjusted U-3 Unemployment- 4.0% Up from 3.8% in June and 3.4% in May but still below 4.1% in February, and 4.4% in January.
- Unadjusted U-6 Unemployment- 7.3% down from 7.5% in June Up from 6.7% in May. It was 7.5% in March, 7.7% in February and 8.8% in January.
- Unadjusted Employment (Establishment Survey)- 151.183 million down from 152.307 million in June up from 148.295 million in January.
- Labor Force Participation Rate- 63.0% up from 62.9% June, 62.8% in April and May but unchanged from 63.0% in March and still below the peak of 63.2% in February.
Although they rose a notch in June (and stayed there in July), current Seasonally Adjusted U-3 levels are still below the 3.8% lows of 2000. Prior to that, we have to go all the way back to 1969 to see better unemployment levels than we have currently. If we break below 3.4% we have to go all the way back to 1953 (during the Korean War) to find lower levels. And we must remember that there was a massive loss of the workforce due to the war, and a higher percentage of the population was not counted due to “farming”, so we probably won’t see levels that low again. The 1969 lows occurred during the Vietnam war. Prior to 1969 was a low of 3.7% in 1957 so we are currently at that level. As we can see from the above chart we are in one of only 5 “green zones” where unemployment levels are below 4%. Not even the “boom” period 2006-2007 reached such low levels.
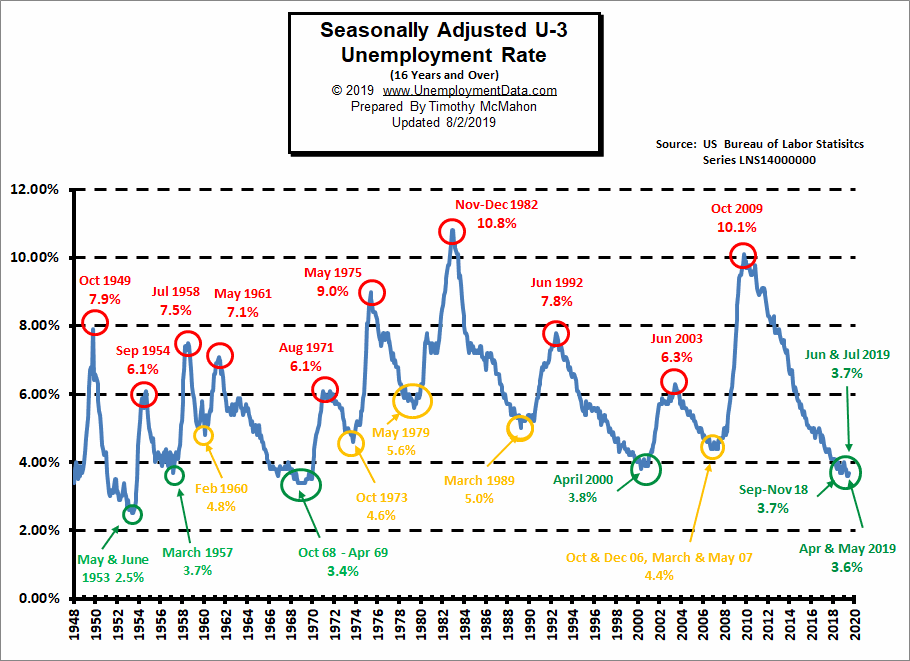
See Current Unemployment Chart for more info.
Unemployment Rates by Educational Attainment
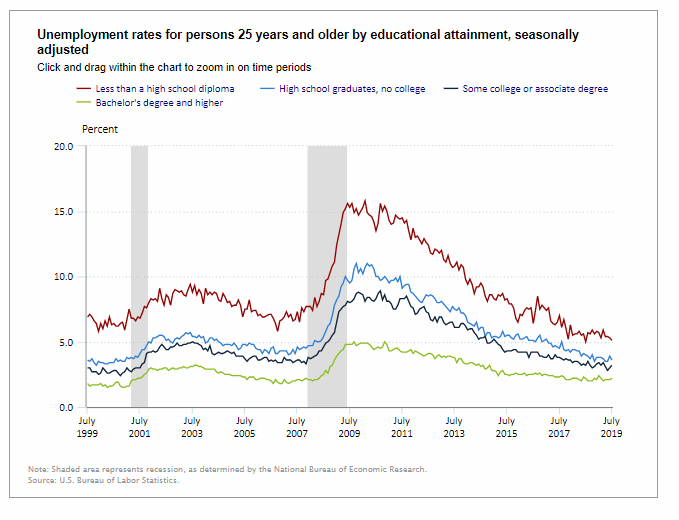
As we can see from the above chart whether it is during a recessionary period (grey shaded areas) or during more normal periods your education plays a major part in whether you are unemployed. At the peak of the recession in June of 2009, those with a Bachelor’s Degree suffered a 4.8% unemployment rate while those with some college or an Associate’s Degree had an 8.1% Unemployment Rate. Worse off were those with only a High School Degree who had a 10% unemployment rate and those who did not finish High School suffered the worst with 15.6% unemployment. But even today with one of the lowest unemployment rates in history education still makes a difference. Unfortunately, the chart does not include a category for individuals with a trade school degree. I find it hard to believe that people stop needing plumbers just because the economy is in a slump. Although building construction will have slacked off causing a decrease in the need for those who work in new construction.
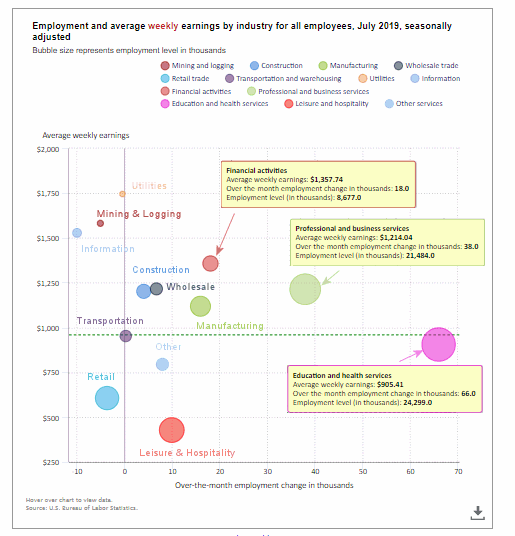
Employment by Sector
The employment “bubble chart” gives us a good representation of how each sector of the economy is doing (employment wise). As we can see from the chart below there are three sectors to the left of the vertical zero line this month, meaning that they lost employees (plus two others there were almost exactly on the line). The biggest loser is information with a loss of -10,000 jobs. The other big loser is Mining and Logging -5,000 jobs. Retail also lost -3,600 jobs.
The biggest gainer (furthest to the right on the chart) was Education and Health Services adding 66,000 jobs on top of last month’s 61,000 jobs, unfortunately, this is a fairly low paid sector, earning only $905.41 on average per week. Professional and Business Services added 38,000 and Manufacturing added 16,000 jobs.
Average weekly wages fell slightly. It was $959.76 in June and fell to $959.71 in July. But still above the $955.29 in April and $957.35 in May.
 (See the table below for details.)
How to read this chart:
Bubbles location on the chart tell us two things:
- Change in Employment Levels over the most recent month.
- Average Weekly earnings.
- The further to the right the bubble the larger the increase in the number of jobs.
- The higher up on the chart the larger the average salary.
Bubble Size tells us:
- Total Employment for the sector.
- Larger bubbles mean more people are employed in that sector.
Employment and Average Weekly Earnings by Industry
July 2019, Seasonally Adjusted
| Industry | Monthly Increase | Average Weekly Earnings | Employment Level |
| Total Private Employment | 148,000 | $959.71 | 128,899,000 |
| Mining and Logging | -5,000 | $1,581.78 | 752,000 |
| Construction | 4,000 | $1,202.33 | 7,505,000 |
| Manufacturing | 16,000 | $1,119.08 | 12,864,000 |
| Wholesale trade | 6,700 | $1,215.99 | 5,940,600 |
| Retail trade | -3,600 | $606.63 | 15,764,200 |
| Transportation and Warehousing | 300 | $952.88 | 5,564,200 |
| Utilities | -400 | $1,745.55 | 554,400 |
| Information | -10,000 | $1,528.84 | 2,819,000 |
| Financial Activities | 18,000 | $1,357.74 | 8,677,000 |
| Professional and Business Services | 38,000 | $1,214.04 | 21,484,000 |
| Education and Health Services | 66,000 | $905.41 | 24,299,000 |
| Leisure and Hospitality | 10,000 | $428.02 | 16,716,000 |
| Other Services | 8,000 | $795.00 | 5,949,000 |
Previous Record Low Unemployment (Seasonally Adjusted U-3)
If we consider anything 4% or below as “low” we have had a few “low” stretches as we can see in the table below.
(4% or below in Green)
| Jan | Feb | Mar | Apr | May | Jun | Jul | Aug | Sep | Oct | Nov | Dec | |
| 1950 | 6.5% | 6.4% | 6.3% | 5.8% | 5.5% | 5.4% | 5.0% | 4.5% | 4.4% | 4.2% | 4.2% | 4.3% |
| 1951 | 3.7% | 3.4% | 3.4% | 3.1% | 3.0% | 3.2% | 3.1% | 3.1% | 3.3% | 3.5% | 3.5% | 3.1% |
| 1952 | 3.2% | 3.1% | 2.9% | 2.9% | 3.0% | 3.0% | 3.2% | 3.4% | 3.1% | 3.0% | 2.8% | 2.7% |
| 1953 | 2.9% | 2.6% | 2.6% | 2.7% | 2.5% | 2.5% | 2.6% | 2.7% | 2.9% | 3.1% | 3.5% | 4.5% |
| 1954 | 4.9% | 5.2% | 5.7% | 5.9% | 5.9% | 5.6% | 5.8% | 6.0% | 6.1% | 5.7% | 5.3% | 5.0% |
| 1955 | 4.9% | 4.7% | 4.6% | 4.7% | 4.3% | 4.2% | 4.0% | 4.2% | 4.1% | 4.3% | 4.2% | 4.2% |
| 1956 | 4.0% | 3.9% | 4.2% | 4.0% | 4.3% | 4.3% | 4.4% | 4.1% | 3.9% | 3.9% | 4.3% | 4.2% |
| 1957 | 4.2% | 3.9% | 3.7% | 3.9% | 4.1% | 4.3% | 4.2% | 4.1% | 4.4% | 4.5% | 5.1% | 5.2% |
| 1958 | 5.8% | 6.4% | 6.7% | 7.4% | 7.4% | 7.3% | 7.5% | 7.4% | 7.1% | 6.7% | 6.2% | 6.2% |
| … | … | … | … | … | … | … | … | … | … | … | … | … |
| 1965 | 4.9% | 5.1% | 4.7% | 4.8% | 4.6% | 4.6% | 4.4% | 4.4% | 4.3% | 4.2% | 4.1% | 4.0% |
| 1966 | 4.0% | 3.8% | 3.8% | 3.8% | 3.9% | 3.8% | 3.8% | 3.8% | 3.7% | 3.7% | 3.6% | 3.8% |
| 1967 | 3.9% | 3.8% | 3.8% | 3.8% | 3.8% | 3.9% | 3.8% | 3.8% | 3.8% | 4.0% | 3.9% | 3.8% |
| 1968 | 3.7% | 3.8% | 3.7% | 3.5% | 3.5% | 3.7% | 3.7% | 3.5% | 3.4% | 3.4% | 3.4% | 3.4% |
| 1969 | 3.4% | 3.4% | 3.4% | 3.4% | 3.4% | 3.5% | 3.5% | 3.5% | 3.7% | 3.7% | 3.5% | 3.5% |
| 1970 | 3.9% | 4.2% | 4.4% | 4.6% | 4.8% | 4.9% | 5.0% | 5.1% | 5.4% | 5.5% | 5.9% | 6.1% |
| … | … | … | … | … | … | … | … | … | … | … | … | … |
| 1999 | 4.3% | 4.4% | 4.2% | 4.3% | 4.2% | 4.3% | 4.3% | 4.2% | 4.2% | 4.1% | 4.1% | 4.0% |
| 2000 | 4.0% | 4.1% | 4.0% | 3.8% | 4.0% | 4.0% | 4.0% | 4.1% | 3.9% | 3.9% | 3.9% | 3.9% |
| 2001 | 4.2% | 4.2% | 4.3% | 4.4% | 4.3% | 4.5% | 4.6% | 4.9% | 5.0% | 5.3% | 5.5% | 5.7% |
| … | … | … | … | … | … | … | … | … | … | … | … | … |
| 2018 | 4.1% | 4.1% | 4.1% | 3.9% | 3.8% | 4.0% | 3.9% | 3.9% | 3.7% | 3.7% | 3.7% | 3.9% |
| 2019 | 4.0% | 3.8% | 3.8% | 3.6% | 3.6% | 3.7% | 3.7% |
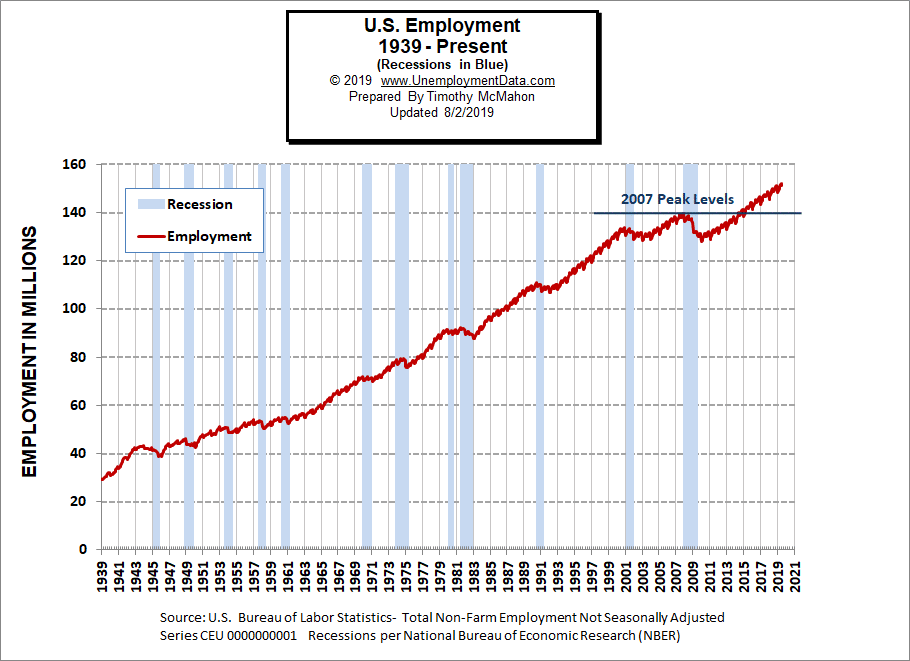
Employment
Historically employment is closely tied to recessions and that is no accident. One of the primary factors in calculating whether the economy is officially in a recession is an increase in the unemployment rate. The chart below provides the Historical Employment Data overlaid on blue bars showing periods of official recessions.
In July seasonal factors took their toll and employment fell to 151.183 million from the 152.307 million people employed according to the BLS’ original June report but then they adjusted it down to 152.242. May employment was 151.610 million up from 150.938 million in April, 149.864 million in March, 149.148 million in February and 148.295 million in January. That was 2.235 million more than the previous July. As we can from the chart the largest loss in numbers of jobs occurred during the “Great Recession” of 2008 and it took several years before employment levels once again reached 2007 levels.
 As we can see from the table below from November 2007 to January 2008 there were over 3 million jobs lost but that actually wasn’t all that surprising. Typically January suffers from a reduction in Seasonal workers. Even good years like 2005-2006 saw a reduction of 3 million workers and January 2008 employment levels were still above January 2007 levels. But by January 2009 year over year losses exceeded 4 million. By 2010 the economy had lost another 4.2 million. 2011 showed almost a million jobs improvement but the economy was still on shaky ground. It wasn’t until January 2014 that the economy reached January 2007 levels and January 2015 exceeded January 2008 levels.
| Date | Employment in Millions |
| January 2007 | 135.335 |
| November 2007 (Peak) | 139.510 |
| January 2008 | 136.268 |
| January 2009 | 132.042 |
| January 2010 | 127.820 |
| January 2011 | 128.778 |
| January 2012 | 131.113 |
| January 2013 | 133.081 |
| January 2014 | 135.488 |
| January 2015 | 138.511 |
| January 2016 | 141.088 |
| January 2017 | 143.393 |
| January 2018 | 145.428 |
| January 2019 | 148.295 |
| February 2019 | 149.148 |
| March 2019 | 149.864 |
| April 2019 | 150.938 |
| May 2019 | 151.600 |
| June 2019 | 152.307 |
| July 2019 | 151.183 |
Employment Numbers are “Preliminary” for two months before the BLS considers them finalized due to late coming data.
Current Employment
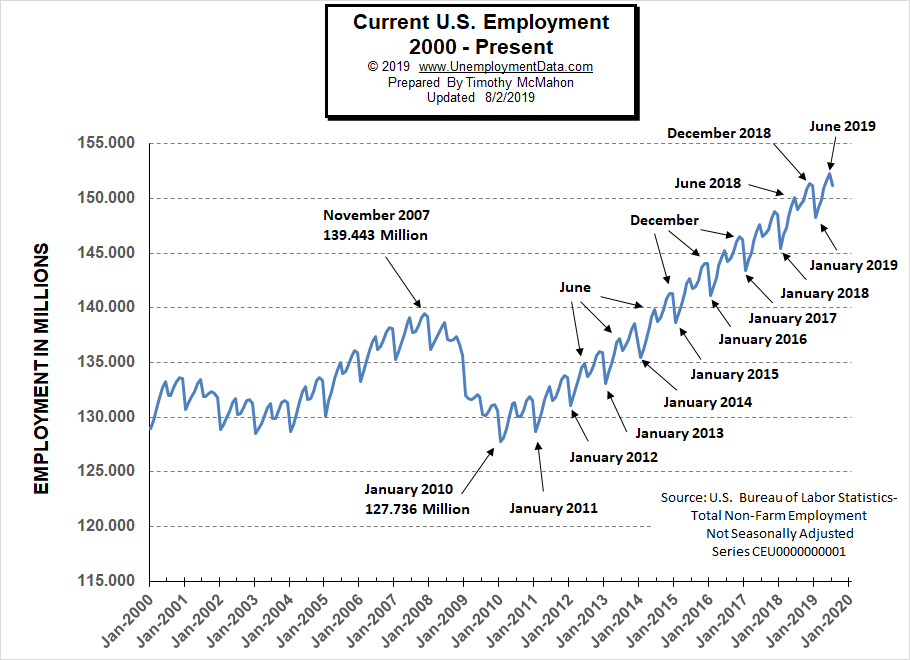
From the above current employment chart, we can see that the low point for each year occurs in January and then a small peak occurs around June with a slight drop around July and then the highest peak in employment happens in November/December. So the current drop in July is entirely normal.
See Historical Employment and Current Employment for more info.
The Differential between U3 and U6
The previous lows on this chart are at 2.7% in October 2000 and 3.2% in September 2006. In August, September, and October of 2018, the differential between unadjusted U-3 and unadjusted U-6 dropped to 3.5% indicating that we were getting closer to “full employment” but then in December, the U-6 ticked up to 7.5% from 7.2% a month earlier and the differential ticked back up to 3.8%.
Typically the differential peaks in January and this year was no exception. In January 2019 U-6 shot up to 8.8% and U-3 was 4.4% for a differential of 4.4%. In February the differential fell back to 3.6%. From there we saw it fall to 3.3% in May rise in June and then fall back to 3.3% in July.
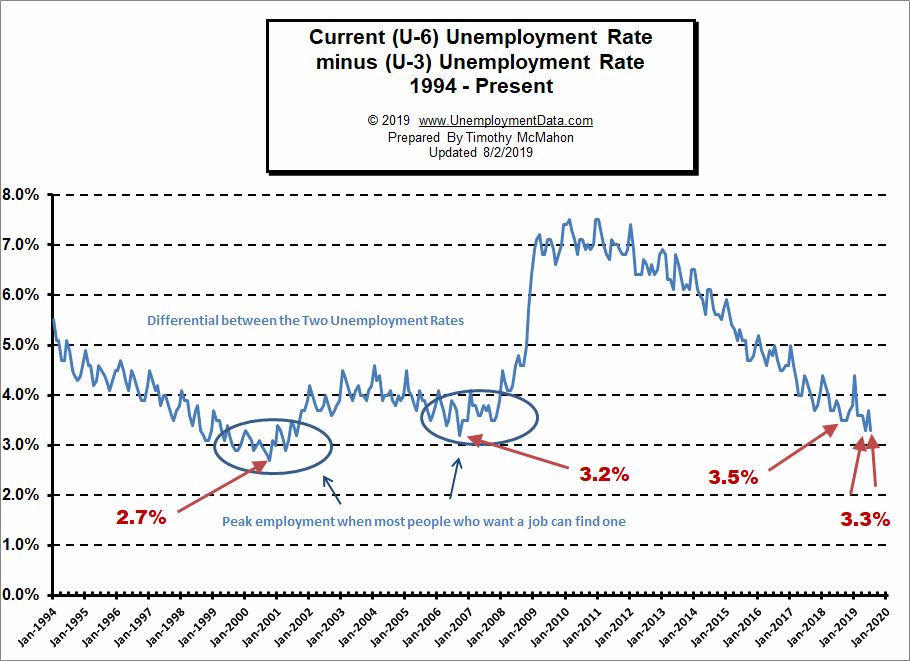
See Current U-6 Unemployment Rate for more info.
U-6 Unemployment
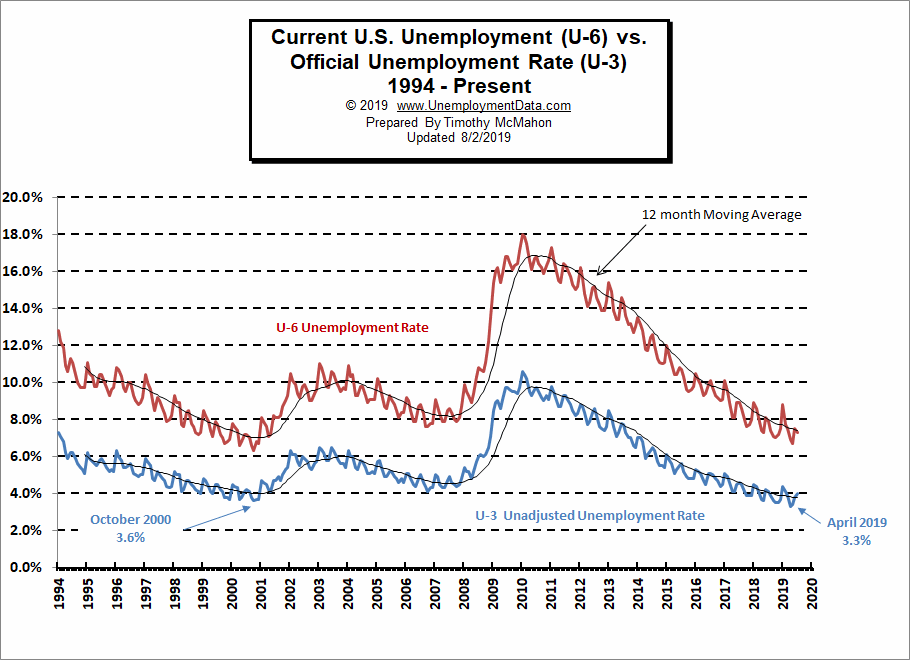
Current U-6 Unadjusted Unemployment Rate for July fell to 7.3% from June’s 7.5% it was 6.7% in May and 6.9% in April.
Unadjusted U-6 is down from 7.5% to 7.3% while Unadjusted U-3 is up from 3.8% to 4.0%. In this case, it looks like systemic unemployment is falling while typical seasonal variations are temporarily increasing unemployment.
See Unadjusted U-6 unemployment for more info.
Labor Force Participation Rate
The Labor Force Participation Rate (LFPR) for July was 63.0% up from 62.9% in June. May and April were 62.8%. March was also 63.0%, below it’s January and February peak at 63.2%.
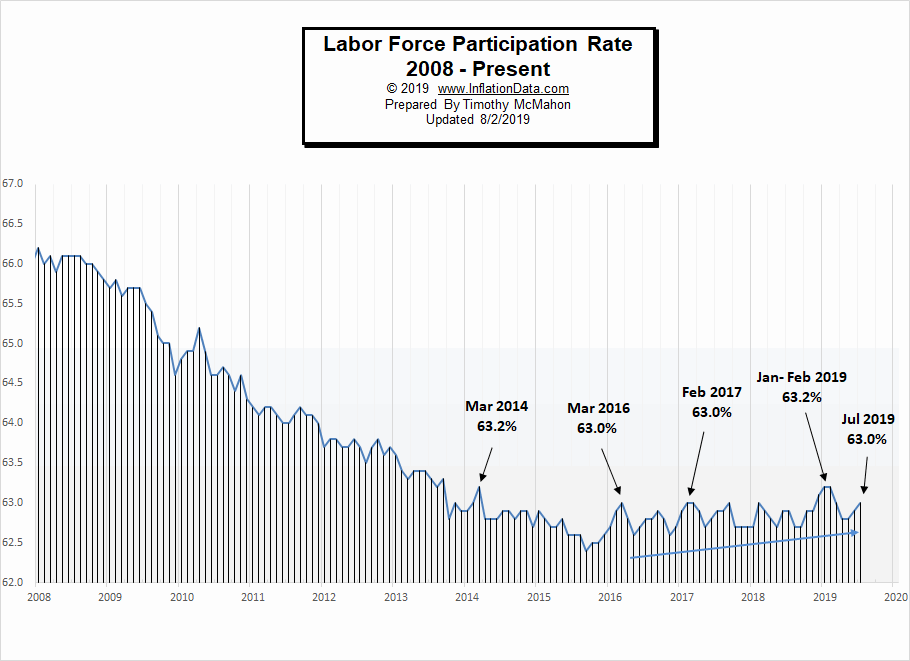
See Labor Force Participation Rate for more information.
Employment-Population Ratio
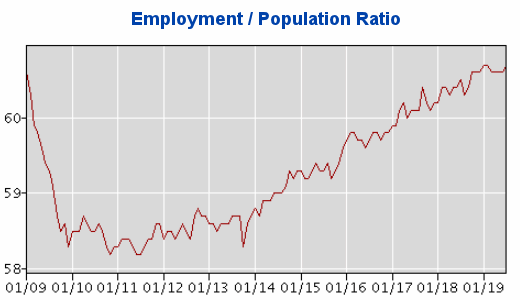
The index many people think of when they hear the term Labor Force Participation Rate might be better described by the Employment-Population Ratio. This index shows the percentage of the entire population that is working. In many ways, it is a better index than the LFPR or the Unemployment rate. Current levels are back in the range of where they were in 2009 even though the population has drastically increased.
Here are some articles you might enjoy in case you missed them:
Read more on UnemploymentData.com.
- Jobs that Don’t Require a 4 Year Degree
- 4 Tips for Job Searching with Little Work Experience
- Unemployment By State and Political Party
- Being Unemployed Is Tough… Doing These 8 Things Can Make Your Life Better
- 4 Degrees to Consider if You Want a Job Right out of College
From InflationData.com
- How High Inflation Drives Countries Towards Crypto
- June Inflation: Down Again
- Gold Price and Its Relationship with Inflation
- Annual Inflation in May: Down
- How Does Inflation Affect Foreign Exchange Rates
- Oil Price Inflation Charts and Tables Updated
- Health Insurance Inflation Over the Last 10 Years
- Are Deflationary Forces Taking Hold Again?
- Gold as an Investment
- How Inflation and Interest Rates Relate
From Financial Trend Forecaster
- Turning Nuclear Waste into “Perpetual” Batteries
- 4 Precious Metals to Consider
- The Future of Social Security Disability
- U.S. Develops New “Humanitarian” Missile That Doesn’t Kill People
- U.S.-China Trade War: Who will Win?
- Message from the Stock/Bond Ratio
- Do Facts Support Doom and Gloom or Higher Highs for Stocks and/or Gold?
- Want to See What’s Next for the Economy? Try This.
- Elliott Wave: Market Signaling Fed to Cut Rates Soon
- What Typically Happens When These Charts Flip?
- Are Rate Cuts a “Death Knell” for Stocks?
- Is War Good for Stocks?
- The Long-Term Message from the VIX
From OptioMoney.com
- Avoid a Money Pit: 4 Vital Inspection Items before Buying an Older Home
- 3 Benefits of Finding a Reliable Family Lawyer
- 4 Hidden Car Costs
- Buying and Selling Ranch Land: A Beginner’s Guide
- 4 Tips to Cover the Bills When Your Disability Keeps You Home
- Investments You’ll Thank Yourself for in Twenty Years
From Your Family Finances
- Key Factors in Getting a Mortgage
- Car Hunting on a Budget
- A Beginner’s Guide to Investing: Major Dos & Don’ts
- How to Help Save Your Budget and Credit After a Car Accident
- Remodel Your Family Backyard and Save Some Money
- How to Teach Teens about Finances
- Tips to Afford a Home and Yard for a Small Family
- How to Prepare Your Budget for Big Purchases
- 4 Ways to Cut Back on Your Budget to Save for a down Payment