The U.S. Bureau of Labor Statistics released the Employment and Unemployment rates for the month of April 2015 on Friday May 8th. The commonly quoted Seasonally Adjusted U-3 Unemployment rate was 5.4% down slightly from 5.5% in both February and March.
The unadjusted U3 was 5.1% while the broader unadjusted U6 (which takes into account those who have given up looking for work and those who are working part-time but would prefer to work full-time) was at 10.4%.
The independently calculated Gallup equivalent of the unadjusted U3 was significantly higher at 5.9% (see BLS vs Gallup). Gallup also calculates the U6 equivalent at 14.8% that is 4.4% higher than the BLS. In addition, Gallup calculates that only 43.9% of the population is working down from 44.2% a month earlier.
The BLS commissioner reported an increase of 223,000 jobs in April, but had reported an increase of 126,000 jobs in March only to adjust that number down by 39,000 jobs this month. So after removing almost 1/3rd of March’s job increase the final job increase for March was 85,000.

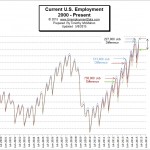
This chart shows the actual number (unadjusted) of Non-farm jobs in the United States as tracked by the U.S. Bureau of Labor statistics. Historical Employment Data Series CEU 0000000001.
