
![]() According to the the U.S. Bureau of Labor Statistics (BLS) monthly unemployment survey results for the month of September 2018 the current “Seasonally Adjusted” Unemployment Rate for September is 3.7% the lowest level since December 1969 when it was 3.5%. Unfortunately, by December 1970 unemployment was up to 6.1%.
According to the the U.S. Bureau of Labor Statistics (BLS) monthly unemployment survey results for the month of September 2018 the current “Seasonally Adjusted” Unemployment Rate for September is 3.7% the lowest level since December 1969 when it was 3.5%. Unfortunately, by December 1970 unemployment was up to 6.1%.
The lowest level reached in the 1968-1969 timeframe was 3.4% where it hovered from September 1968 through May 1969. The only other time that unemployment was this low since they began tracking unemployment in 1948 was briefly in 1948 and again in 1951-53.
| Jan | Feb | Mar | Apr | May | Jun | Jul | Aug | Sep | Oct | Nov | Dec | |
| 1965 | 4.9% | 5.1% | 4.7% | 4.8% | 4.6% | 4.6% | 4.4% | 4.4% | 4.3% | 4.2% | 4.1% | 4.0% |
| 1966 | 4.0% | 3.8% | 3.8% | 3.8% | 3.9% | 3.8% | 3.8% | 3.8% | 3.7% | 3.7% | 3.6% | 3.8% |
| 1967 | 3.9% | 3.8% | 3.8% | 3.8% | 3.8% | 3.9% | 3.8% | 3.8% | 3.8% | 4.0% | 3.9% | 3.8% |
| 1968 | 3.7% | 3.8% | 3.7% | 3.5% | 3.5% | 3.7% | 3.7% | 3.5% | 3.4% | 3.4% | 3.4% | 3.4% |
| 1969 | 3.4% | 3.4% | 3.4% | 3.4% | 3.4% | 3.5% | 3.5% | 3.5% | 3.7% | 3.7% | 3.5% | 3.5% |
| 1970 | 3.9% | 4.2% | 4.4% | 4.6% | 4.8% | 4.9% | 5.0% | 5.1% | 5.4% | 5.5% | 5.9% | 6.1% |
Key September Employment and Unemployment Numbers
- Adjusted U-3 Unemployment: 3.7% down from 3.9% in August, This is the lowest Seasonally Adjusted Unemployment rate since 1969.
- Unadjusted U-3 Unemployment: 3.6% down from 3.9% in August and 4.1% in July and 4.2% in June.
- Unadjusted U-6 Unemployment: 7.1% down from 7.4% in August and 7.9% in July, 8.1% in June, and below record lows of 7.3% in May, and 7.4% in April.
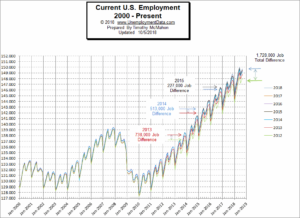
- Employment: 149.741 million up from 149.226 million originally reported for August.
- September Labor Force Participation Rate: 62.7% unchanged from August but down from July 62.9%.
See Current Unemployment Chart for more info.
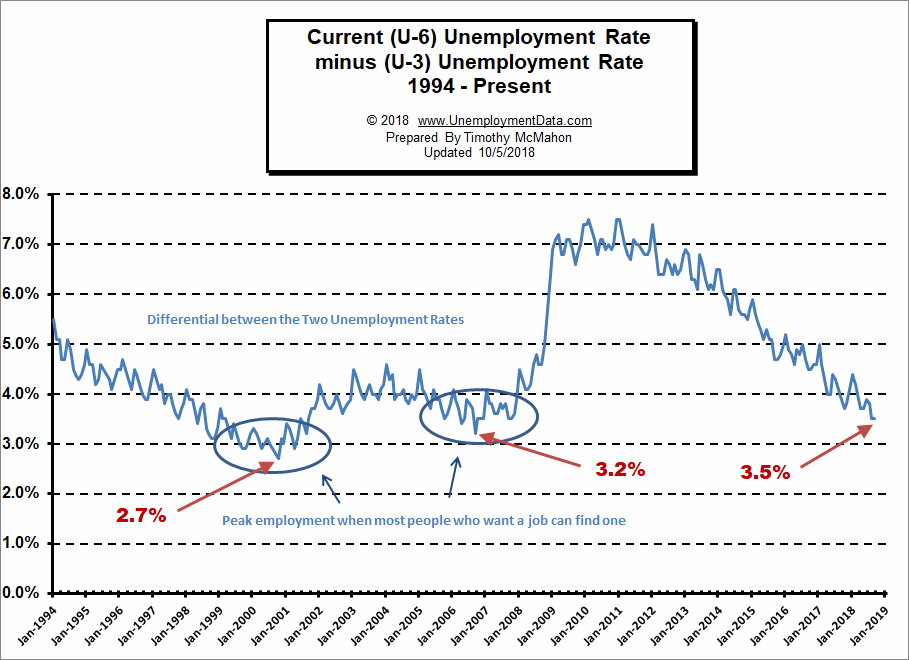
Full Employment is Near – Differential between U3 and U6 nearing September 2006 Lows
Last month we incorrectly reported that the differential between the unadjusted U3 and U6 (reached by subtracting U3 from U6) was at 3.2% when in fact it was only at 3.5% so it still had a little way to go to reach the 3.2% low of September 2006. This month, although both U3 and U6 have fallen the differential remains at the 3.5% level.
See Current U-6 Unemployment Rate for more info.
Employment by Sector
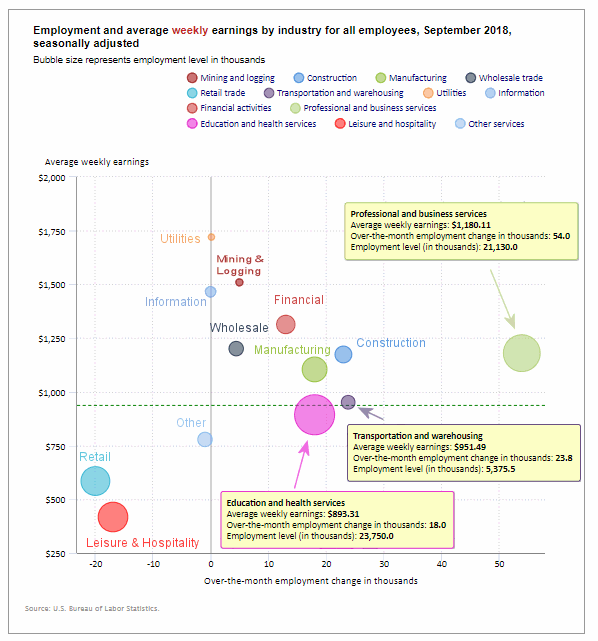
The employment “bubble chart” gives us a good representation of how each sector of the economy is doing (employment wise). As we can see from the chart below the two main sectors that are to the left of the zero line this month indicating that they lost employees are Retail and Leisure and Hospitality. This could be the result of the hurricane.
Next we see that three sectors were virtually unchanged and they are Utilities, Information and Other. The biggest gainer was Professional and Business Services with an increase of 54,000. They currently employ 21.13 million people at an above average salary of $1,180.11 per week.
Mining and Logging, Wholesale, and Financial Activities are smaller sectors but are well paid and had good gains for their sector size. Education and Health, Manufacturing, Construction, and Transportation also had good gains. Average weekly earnings increased by $2.76.
Average weekly wages increased sharply from $937.02 to $939.78.
(See the table below for average weekly earnings and other details.)
How to read this chart:
Bubbles location on the chart tell us two things:
- Change in Employment Levels over the most recent month.
- Average Weekly earnings.
- The further to the right the bubble the larger the increase in the number of jobs.
- The higher up on the chart the larger the average salary.
Bubble Size tells us:
- Total Employment for the sector.
- Larger bubbles mean more people are employed in that sector.
Employment and Average Weekly Earnings by Industry for All Employees
September 2018, Seasonally Adjusted
| Industry | Monthly Increase | Average Weekly Earnings | Employment Level |
| Total Private Employment | 121,000 | $939.78 | 127,094,000 |
| Mining and Logging | 5,000 | $1,509.57 | 751,000 |
| Construction | 23,000 | $1,174.00 | 7,286,000 |
| Manufacturing | 18,000 | $1,104.46 | 12,747,000 |
| Wholesale trade | 4,400 | $1,201.23 | 6,009,900 |
| Retail trade | -20,000 | $584.97 | 15,908,800 |
| Transportation and Warehousing | 23,800 | $951.49 | 5,375,500 |
| Utilities | 100 | $1,720.41 | 551,000 |
| Information | 0 | $1,465.83 | 2,767,000 |
| Financial Activities | 13,000 | $1,313.63 | 8,603,000 |
| Professional and Business Services | 54,000 | $1,180.11 | 21,130,000 |
| Education and Health Services | 18,000 | $893.31 | 23,750,000 |
| Leisure and Hospitality | -17,000 | $417.56 | 16,342,000 |
| Other Services | -1,000 | $778.46 | 5,873,000 |
U-6 Unemployment
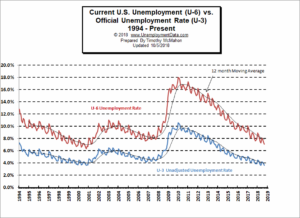
Current U-6 Unemployment Rate for September 2018 is:
7.1% down from 7.4% in August, 7.9% in July and 8.1% in June.
See Unadjusted U-6 unemployment for more info.
Employment
According to the BLS Commissioner’s report for this month:
“The unemployment rate declined to 3.7 percent in September, and nonfarm payroll employment increased by 134,000. Job gains occurred in professional and business services, in health care, and in transportation and warehousing.”.
Note: These are Seasonally adjusted numbers. Actual employment as released last month for August was 149.226 million but was adjusted to 149.391. This month employment is 149.741 for an actual increase of 515,000 over originally released numbers or 350,000 over modified numbers . But the Commissioner is saying that it rose 134,000 more than average for the month of September.
Labor Force Participation Rate
The LFPR for September was unchanged from August at 62.7% down from 62.9% in in July.
Originally, the BLS reported that the June LFPR jumped dramatically to 63.4% exceeding 63.2% for the first time since 2014. But then they walked that back saying it was only 62.9% the same as July 2017 and July 2018. The LFPR for August and May was 62.7%, and in April it was 62.8%, March was 62.9%, February was 63.0%. (Higher is better so a falling LFPR is not good).
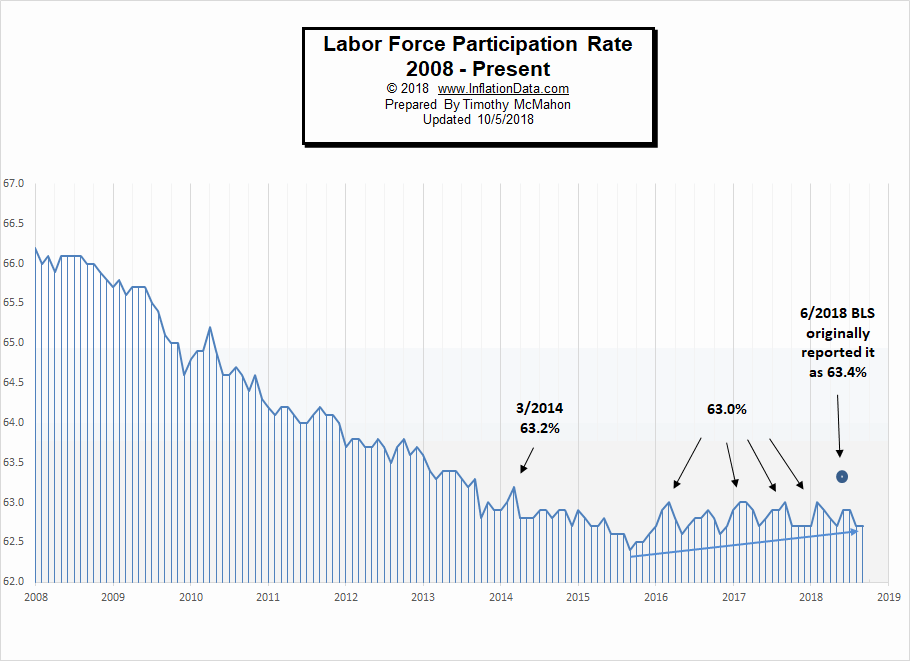
See Labor Force Participation Rate for more information.
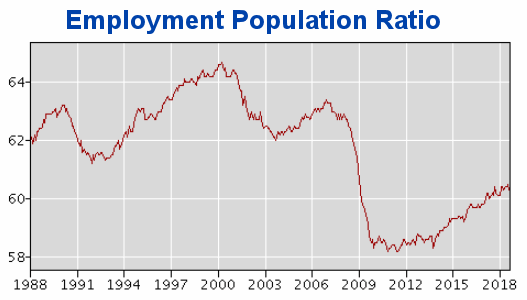
Employment Population Ratio
The index many people think of when they hear the term Labor Force Participation Rate might be better described by the Employment Population Ratio. This index shows the percentage of the entire population that is working. In many ways it is a better index than the LFPR or the Unemployment rate.
Here are some articles you might enjoy in case you missed them:
Read more on UnemploymentData.com.
- 5 Types of Jobs That Are Perfect for When You Can’t Decide Which Degree to Pursue
- Ways to Impress Clients Who Visit Your Office Space
- How to Infuse Your Business with Staying Power
- Full Employment is Near – Differential between U3 and U6 reaches September 2006 Lows
- Start Your New Career Right
- 4 Effective Ways to Promote Your Business
- Careers for Animal Lovers
- Unemployment Rates by State July 2018
- Sports Management and Other Non-Athletic Sports Careers
From InflationData.com
- August Inflation Down
- Can Crypto Solve Venezuela’s Hyperinflation Problem?
- Cost of Living: LA and New York vs. The World
- What Impact (if any) Does Disruption have on Inflation?
- Debt and Inflationary Pressures: A Lesson in Economic Interactivity
- What Impact (if any) Does Disruption have on Inflation?
- Inflation Risk
From Financial Trend Forecaster
- $100 Oil Is A Distinct Possibility
- Do the FED’s Interest Rates Affect the Stock Market?
- Technological Solution to 100 Year Old Oil Problem
- Oil Price War: Saudi Arabia vs. Iran
- Coke, Meth And Booze: The Dark Side Of The Permian Oil Boom
- Why Graphene Hasn’t Taken Over the World- Yet
- New Oil Cartel Threatening OPEC
- 3 Breakthrough Technologies Changing The Energy Sector
From Elliott Wave University
- This Doesn’t Happen in Bear Markets
- What is the Up/Down Volume Saying About the Current Market?
- This Doesn’t Happen in Bear Markets
- Is Gold on the Verge of a Bottom?
- Moving Averages Help You Define Trend – Here’s How
- Charts Say Stocks Could Rise For 10-15 Years
- Latest Economic Data Doesn’t Align with Yield Curve Fears
From OptioMoney.com
- 5 Ways to Reduce Your Business Credit Risk
- How Does a Surety Bond Differ from Insurance?
- When is the Right Time to Buy Life Insurance?
- 4 Things Home Buyers Shouldn’t Do During the Mortgage Process
- Tips for Avoiding Cash Crunches and Managing Cash Flow in Business
- How to Survive Bankruptcy
- How to Lower the Chances of Bankruptcy as a Personal Business Owner
From Your Family Finances
- 4 Tips to Better Managing Your Finances and Assets
- Retiring to the Mountains: Enjoying Your Retirement
- Manage Your Money for Recreation and Fun
- The Importance of Insurance
- Is an FHA Loan Right for You?
- Financial Hard Times: How to Pull Your Family out of Debt
- Are Your Water Bills “Eating You Alive”?
- 3 Ways Keeping Tabs on Your Credit Helps More Than Just Your Finances
- A Guide to: Making the Most of Cash Back Rewards Credit Cards
- How to Start and Build a Valuable Coin Collection