• About WordPress
    • WordPress.org
    • Documentation
    • Learn WordPress
    • Support
    • Feedback
  • Log In
  • Skip to primary navigation
  • Skip to main content
  • Skip to primary sidebar
  • Home
  • Contact us
  • Related Sites
    • InflationData.com
    • Financial Trend Forecaster
    • Your Family Finances
    • Elliott Wave University
    • Optio Money
  • About
    • Terms of Use
    • Disclaimer & Disclosure
    • Privacy Statement
  • Sitemap
    • 2009-2010 Posts
    • 2011 Posts

UnemploymentData.com

Your Source for Employment and Unemployment Data

Unemployment
  • Charts
    • Current Unemployment Rate Chart
    • Current Employment Rate (Chart and Data)
    • Current Employment vs Unemployment Chart
    • Historical Employment Data
    • Employment Population Ratio
    • Misery Index
  • Unemployment
    • Historical Unemployment Rate Tables
    • What Is U-6 Unemployment?
    • Unadjusted vs. Seasonally Adjusted U-3 Unemployment Rate
    • BLS vs. Gallup Unemployment Numbers
    • Current U-6 Unemployment Rate
    • What is the Labor Force Participation Rate?
    • What is the Real Unemployment Rate?
  • Employment
    • Current Employment Rate (Chart and Data)
    • Historical Employment Data
    • Contacting a Live Person at the State Employment Commission
      • How to Talk to a Live Person at the Virginia Unemployment Commission
      • Florida’s FLUID Unemployment Program
    • Benefits
      • Insurance
      • Retirement
    • Careers
    • Employment Costs
    • Experience
    • Government
    • Job Hunting
      • Interview
      • Resume
  • Find Articles
  • Education
    • Skills
  • General
    • Small Business
      • Outsourcing
    • Success
You are here: Home / BLS / Unemployment Down in March

Unemployment Down in March

April 8, 2017 by Tim McMahon

The U.S. Bureau of Labor Statistics (BLS) released their monthly Employment/Unemployment report for the month ending in March on April 7th.  The widely publicized Seasonally Adjusted U-3 Unemployment rate was 4.5% down from 4.7% in February. While the broader U-6 unemployment rate that includes discouraged workers and other “marginally attached” individuals was 8.9% down from 9.5% in February.

The BLS’ Unadjusted U-3 was 4.6% in March down from 4.9% in February. The Gallup alternatives presented mixed results with Gallup’s Unadjusted U-3 at 5.7% up from 5.5% in February while Gallup’s version of the U-6 was unchanged at 13.7%.

The BLS Commissioner’s statement said, “The unemployment rate declined by 0.2 percentage point to 4.5 percent in March. Nonfarm payroll employment edged up by 98,000, following gains in January (+216,000) and February (+219,000). In March, job gains occurred in professional and business services and in mining, while retail employment declined.”

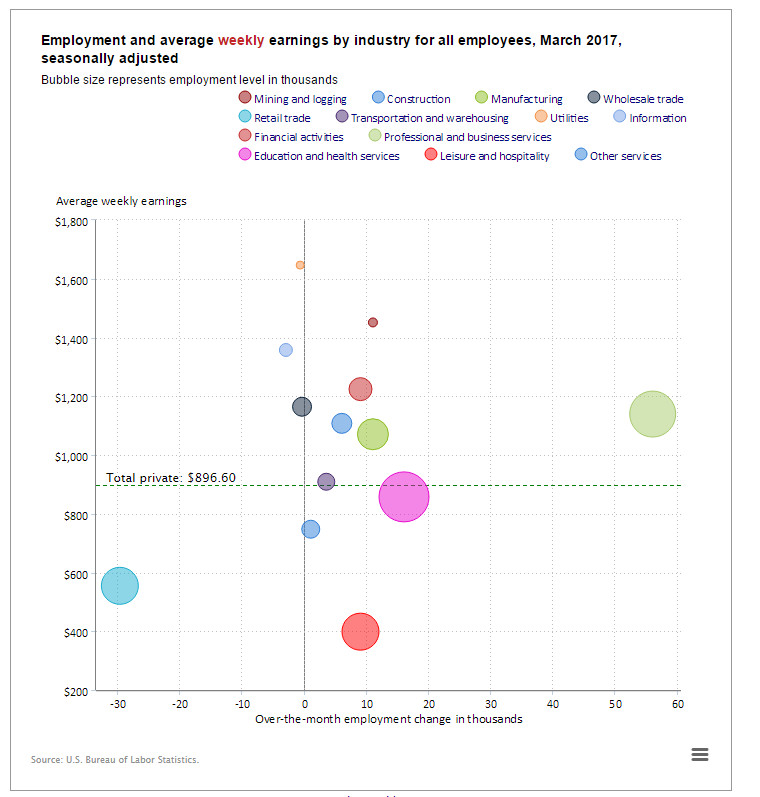
In the above chart we can see employment growth over the month. The light blue circle in the lower left corner represents a loss of  about 30,000 low paying jobs in the retail trade sector. This was partially offset by a gain of about 10,000 even lower paying jobs in the leisure and hospitality industry (red circle) combined with the large pink circle in the center (i.e. Education and Health Services).  Fortunately, There weren’t many circles on the left hand side and the big gainer was in the professional and business services sector (the light green circle) which gained 56,000 jobs and has an above average  weekly salary of $1,139.40.

See Also:

Unemployment Rate Chart –

The seasonally adjusted unemployment rate from 1948 to the present is one of the most watched statistics. Where is it now and should you trust it?


U3 vs U6 Unemployment
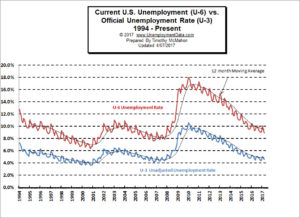
U-6 Unemployment Rate– U-6 is the broadest measure of unemployment and includes all classes of Unemployed plus those “marginally attached” and/or part-time for economic reasons.

Current Employment Data – How many jobs are there actually? This chart shows Employment since Jan 2000 and what the current trend is.

Historical Employment Data Chart– How Many People Are Actually Employed? This chart shows the actual employment rate without all the mumbo jumbo. It gives a clear picture of  the employment level in the United States from 1939 to the Present. When employment is rising the economy is growing. When the employment rate levels off or declines times are not so good. Take a look and see how employment rates correspond to recessions over time.

Misery Index– Created by economist Arthur Okun to help gauge the level of misery the average person is suffering. It is a combination of the inflation rate and the unemployment rate.

Seasonally Adjusted Unemployment Rate in Table form– If you want to see the actual numbers.

Filed Under: BLS Tagged With: employment, March Unemployment

About Tim McMahon

Work by editor and author, Tim McMahon, has been featured in Bloomberg, CBS News, Wall Street Journal, Christian Science Monitor, Forbes, Washington Post, Drudge Report, The Atlantic, Business Insider, American Thinker, Lew Rockwell, Huffington Post, Rolling Stone, Oakland Press, Free Republic, Education World, Realty Trac, Reason, Coin News, and Council for Economic Education. Connect with Tim on Google+

Primary Sidebar

Search Site

Sponsored:

URGENT: These Stocks Stand Poised to Benefit from President Trump's Trade Wars!

As the Trump administration moves ahead with aggressive tariff policies on key imports, the mainstream media is scrambling.

This Free Report - which you can download now - reveals the names and ticker symbols of 5 Stock Poised to Benefit Most from President Trump's Tariff Wars.

Click Here to Download Your FREE Stock Report Now.

Recent Posts

  • April 2025 Employment / Unemployment Report
  • Would More Jobs Help Social Security?
  • March 2025- Employment / Unemployment Report
  • February 2025 Jobs Report
  • January 2025 BLS Employment Report

Resources

  • Bureau of Labor Statistics Current Population Survey Monthly survey of households conducted by the Bureau of Census for BLS. It provides data on the labor force, employment, unemployment, etc.
  • Capital Professional Services Providing web design and development and Internet marketing services
  • Elliott Wave University Using the Elliott Wave Principle to improve investment performance
  • Financial Trend Forecaster Featuring Moore Inflation Predictor, NYSE Rate of Change and NASDAQ Rate of change
  • InflationData.com Inflation calculators, databases, etc.
  • Intergalactic Web Designers Web design and development services
  • Your Family Finances

Articles by Category

Articles by Date

Disclaimer

At UnemploymentData.com we are not registered investment advisors and do not provide any individualized advice. Past performance is not necessarily indicative of future performance and future accuracy and profitable results cannot be guaranteed.

Privacy & Terms of Use

Privacy Statement & Terms of Use

Do Not Sell My Information

Copyright © 2025 · News Pro on Capital Professional Services, LLC. All rights reserved · Log in