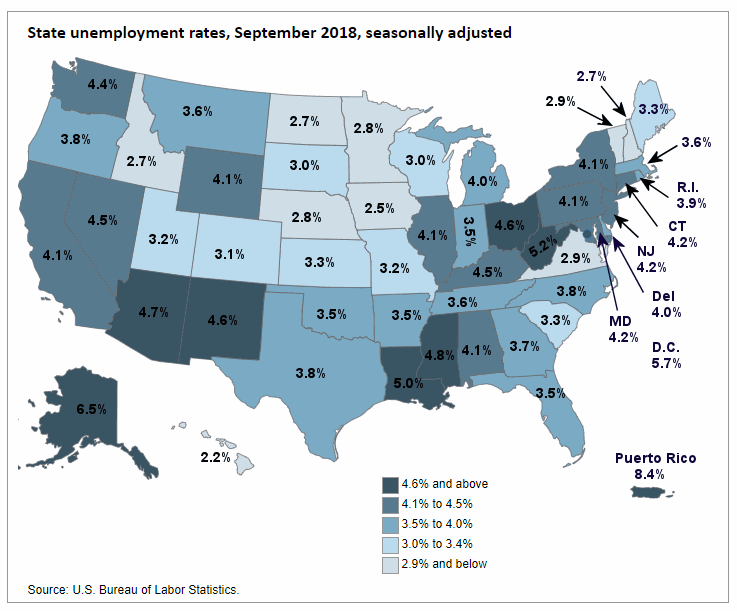
The U.S. Bureau of Labor Statistics reported on Unemployment rates by state on Friday October 19th. Seasonally adjusted unemployment rates for September fell over the previous month in 9 states, were higher in 4 states, and stable in 37 states and the District of Columbia.
Nonfarm payroll employment increased in 1 state, decreased in 9 states, and was stable in 37 states and D.C.
In the following map we can see the states with the lowest unemployment are light colored while the higher unemployment states are darker colored.
Unemployment
Arkansas, California, Idaho, South Carolina, Texas and Washington Set New Series Lows
Hawaii had the lowest seasonally adjusted unemployment rate in September, at 2.2%. Arkansas (3.5%), California (4.1%), Idaho (2.7%), South Carolina (3.3%), Texas (3.8%), and Washington (4.4%) set a new series low since tracking began in 1976. At 6.5% Alaska had the highest jobless rate, not counting Puerto Rico’s 8.4% which is down 2.2% from year ago levels. In total, 13 states had unemployment rates lower than the U.S. figure of 3.7 percent, 12 states plus the District of Columbia and Puerto Rico had higher rates, and 25 states had rates that were not appreciably different from that of the nation.
In September, 9 states had unemployment rate decreases, the largest of which were in Alaska, Florida, and Oklahoma (-0.2 percentage point
each). Four states had over-the-month rate increases: Colorado and Wyoming (+0.2 percentage point each) and Maine and North Dakota (+0.1 point each). The remaining 37 states and the District of Columbia had jobless rates that were not notably different from those of a month earlier, though some had changes that were at least as large numerically as the significant changes.
State Unemployment Rates, September 2018, Seasonally Adjusted
| State | September 2018 | September 2017 | 12-month |
|---|---|---|---|
|
Alabama |
4.1% | 3.9% | 0.0% |
|
Alaska |
6.5% | 7.2% | -0.7% |
|
Arizona |
4.7% | 4.7% | 0% |
|
Arkansas |
3.5% | 3.7% | -0.2 |
|
California |
4.1% | 4.5% | -0.4% |
|
Colorado |
3.1% | 3.0% | 0.1% |
|
Connecticut |
4.2% | 4.5% | -0.3% |
|
Delaware |
4.0% | 4.5% | -0.5% |
|
D.C. |
5.7% | 6.0% | -0.3% |
|
Florida |
3.5% | 3.9% | -0.4% |
|
Georgia |
3.7% | 4.5 | -0.8% |
|
Hawaii |
2.2% | 2.2% | 0% |
|
Idaho |
2.7% | 3.0% | -0.3% |
|
Illinois |
4.1% | 5.0% | -0.9% |
|
Indiana |
3.5% | 3.5% | 0% |
|
Iowa |
2.5% | 3.0% | -0.5% |
|
Kansas |
3.3% | 3.6% | -0.3% |
|
Kentucky |
4.5% | 4.7% | -0.2% |
|
Louisiana |
5.0% | 4.8% | 0.2% |
|
Maine |
3.3% | 3.3% | 0% |
|
Maryland |
4.2% | 4.0% | 0.2% |
|
Massachusetts |
3.6% | 3.6% | 0% |
|
Michigan |
4.0% | 4.7% | -0.7% |
|
Minnesota |
2.8% | 3.3% | -0.5% |
|
Mississippi |
4.8% | 4.9% | -0.1% |
|
Missouri |
3.2% | 3.6% | -0.4% |
|
Montana |
3.6% | 4.1% | -0.5% |
|
Nebraska |
2.8% | 2.9% | -0.1% |
|
Nevada |
4.5% | 4.9% | -0.4% |
|
New Hampshire |
2.7% | 2.6% | 0.1% |
|
New Jersey |
4.2% | 4.7% | -0.5% |
|
New Mexico |
4.6% | 6.0% | -1.4% |
|
New York |
4.1% | 4.7% | -0.6% |
|
North Carolina |
3.8% | 4.4% | -0.6%% |
|
North Dakota |
2.7% | 2.6% | 0.1 |
|
Ohio |
4.6% | 5.0% | -0.4% |
|
Oklahoma |
3.5% | 4.1% | -0.6% |
|
Oregon |
3.8% | 4.2% | -0.4% |
|
Pennsylvania |
4.1% | 4.8% | -0.7% |
|
Rhode Island |
3.9% | 4.5% | -0.6% |
|
South Carolina |
3.3% | 4.2% | -0.9% |
|
South Dakota |
3.0% | 3.4% | -0.4% |
|
Tennessee |
3.6% | 3.3% | 0.3% |
|
Texas |
3.8% | 4.0% | -0.2% |
|
Utah |
3.2% | 3.2% | 0% |
|
Vermont |
2.9% | 2.9% | 0% |
|
Virginia |
2.9% | 3.6% | -0.7% |
|
Washington |
4.4% | 4.7% | -0.3% |
|
West Virginia |
5.2% | 5.3% | -0.1% |
|
Wisconsin |
3.0% | 3.3% | -0.3% |
|
Wyoming |
4.1% | 4.1% | 0% |
|
Puerto Rico |
8.4% | 10.6% | -2.2% |
Nonfarm Payroll Employment
Three states had over-the-month decreases in nonfarm payroll employment in September 2018: North Carolina (-21,900), South Carolina (-14,500), and Kansas (-6,900). In percentage terms, the largest decrease occurred in South Carolina (-0.7 percent), followed by Kansas and North Carolina (-0.5 percent each). Georgia added jobs over the month (+15,300, or +0.3 percent).
Thirty-seven states had over-the-year increases in nonfarm payroll employment in September. The largest job gains occurred in Florida (+407,300), Texas (+406,400), and California (+339,600). The largest percentage gain occurred in Florida (+4.8 percent), followed by Utah (+3.6 percent) and Texas (+3.3 percent).
You might also like:
- Unemployment Reaches Lowest Point Since 1969
- EU Unemployment Nearing Pre-Recession Levels
- California at 4.3% has Lowest Unemployment Since 1976
- What Causes a State to Have a Lower Unemployment Rate?

