
The U.S. Bureau of Labor Statistics (BLS) released its employment / unemployment report for November on December 8th, 2023.
Employment Up- Unemployment Down
![]()
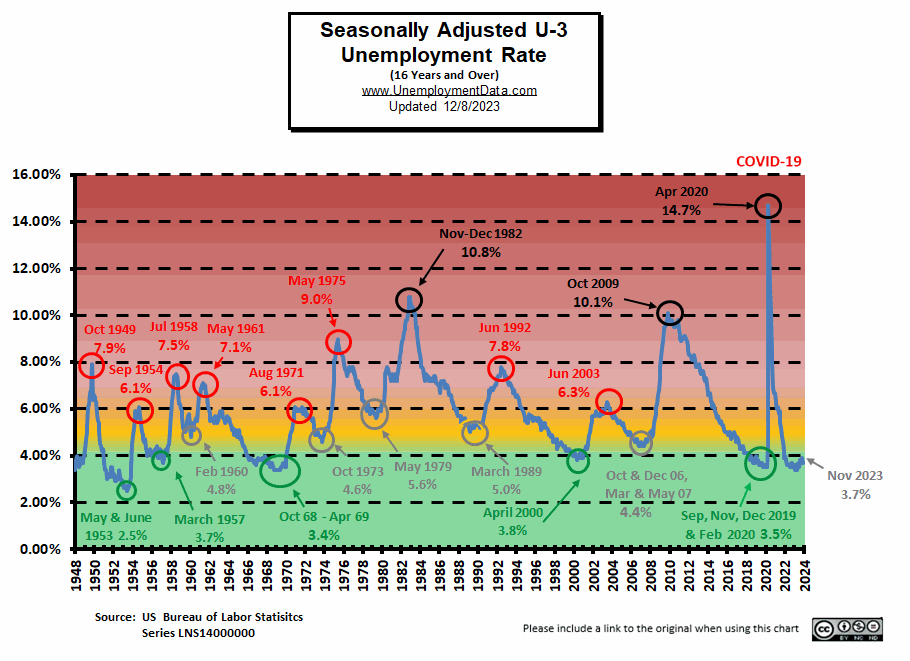
- Adjusted U-3 was 3.7% down from 3.9% in October
- Unadjusted U-3 was 3.5% down from 3.6% in October
- Unadjusted U-6 was 6.7% down from 6.8% in October
- Labor Force Participation was 62.7% down from 62.8% in October
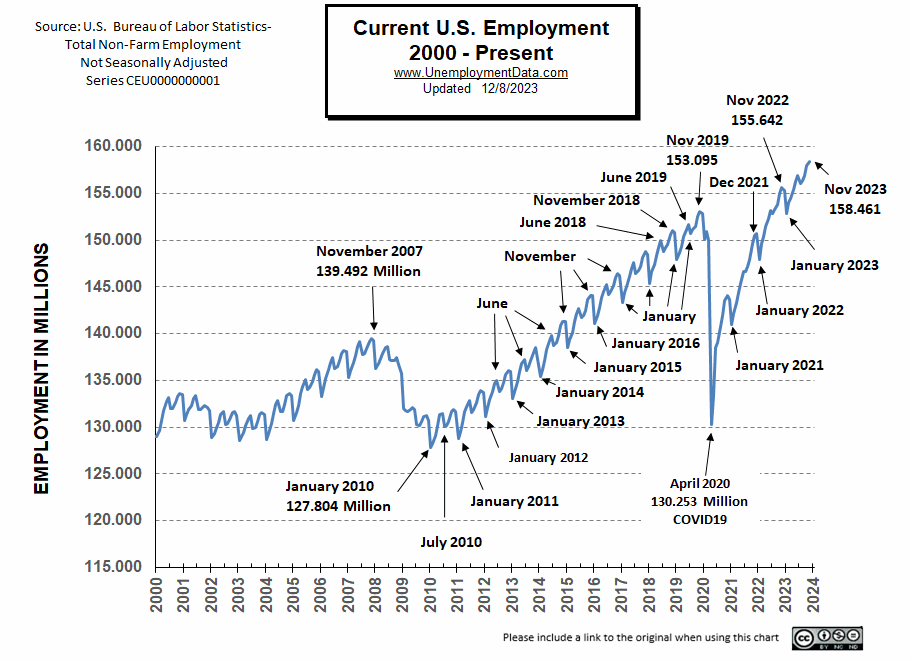
- Unadjusted Employment rose from 157.984 million to 158.461 million
Summary:
Total Employed increased in November, Unemployment was down, and Labor Force Participation was up.
According to the Commissioner of the U.S. Bureau of Labor Statistics:
“Total nonfarm payroll employment increased by 199,000 in November, and the unemployment rate
edged down to 3.7 percent, the U.S. Bureau of Labor Statistics reported today. Job gains
occurred in health care and government. Employment also increased in manufacturing, reflecting
the return of workers from a strike. Employment in retail trade declined…
Among the major worker groups, the unemployment rate for teenagers (11.4 percent) edged down
in November. The jobless rates for adult men (3.7 percent), adult women (3.1 percent), Whites
(3.3 percent), Blacks (5.8 percent), Asians (3.5 percent), and Hispanics (4.6 percent) showed
little or no change over the month.”
You can read the full BLS report here.
As usual, they are talking about “Seasonally Adjusted Jobs”.
Looking at the Unadjusted Establishment Survey report we see…
Originally the BLS reported employment of 157.984 million for October which uncharacteristically they didn’t adjust in November. They are currently reporting 158.461 million jobs for November which is actually an increase of 477,000 jobs. The LFPR rose from 62.7 to 62.8%.
BLS Source
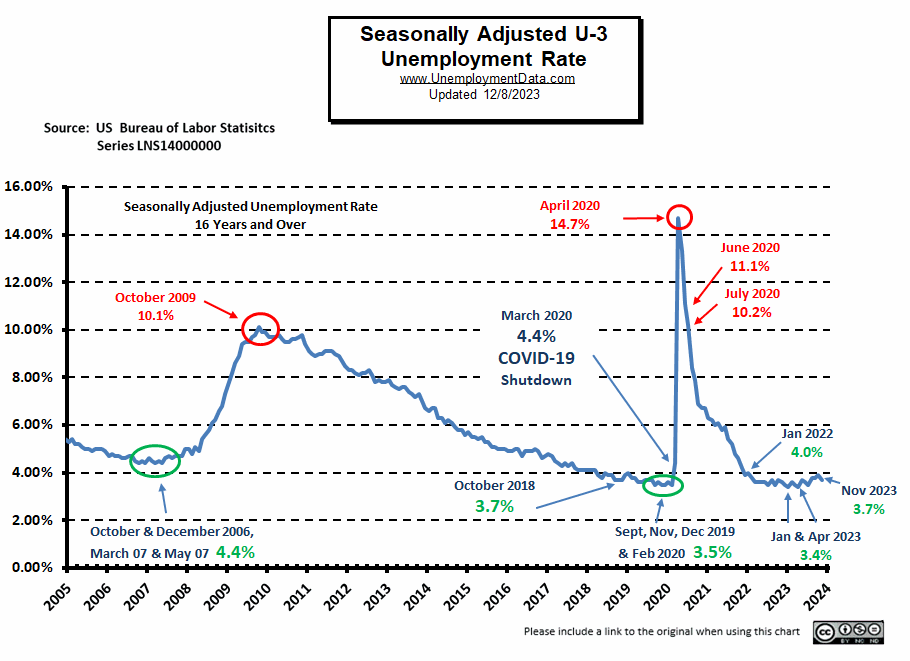
Current Unemployment Rate Chart
Adjusted Unemployment is slightly above the pre-COVID 2019 cyclical lows of 3.5% as well as above the lows made earlier this year. Current levels are still within the “Green Zone”.
Current Employment Rate
Employment 2.819 million Above Year-Ago Levels
and 7.493 million above February 2020 (prior to the Covid Crash)
However, the Civilian Population has also increased by about 8.194 million since February 2020.
Up for the month, at 158.61 million, November 2023 Employment is above the November 2022 peak employment level of 155.642 million.
 See Current Employment for more information.
ADP® National Employment Report
ADP provides an independent (non-government) estimate of private-sector employment and pay, based on data derived from ADP client payrolls. According to ADP®, In collaboration with Stanford Digital Economy Lab.
ADP: Private employers added 103,000 jobs in November.
(This is 10,000 less than were added in October).
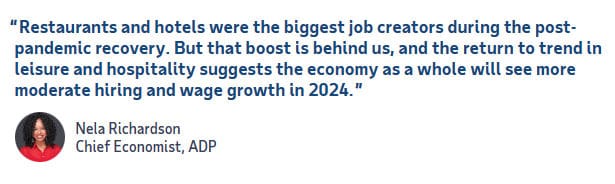
- Last month brought moderate growth in hiring and another slowdown in pay gains. Both goods and services saw weakness, with leisure and hospitality and manufacturing posting declines.
Source: ADP® Pay Insights
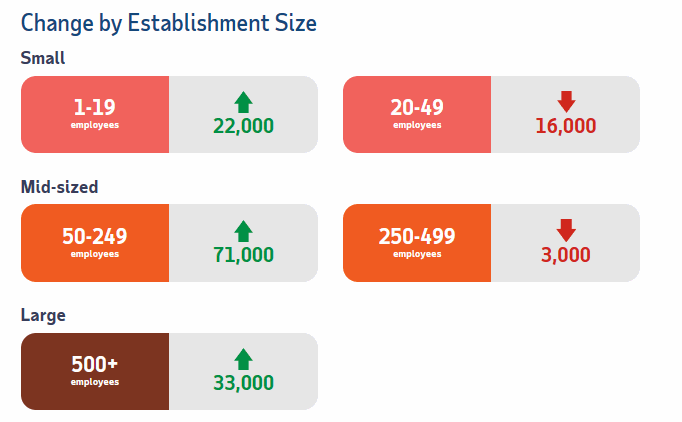
ADP Private Employment by Firm Size
ADP also lists increases by “firm size”.
This month, gains were powered primarily by large corporations and may reflect employees returning from strikes.
November ADP Changes:
October ADP Changes:
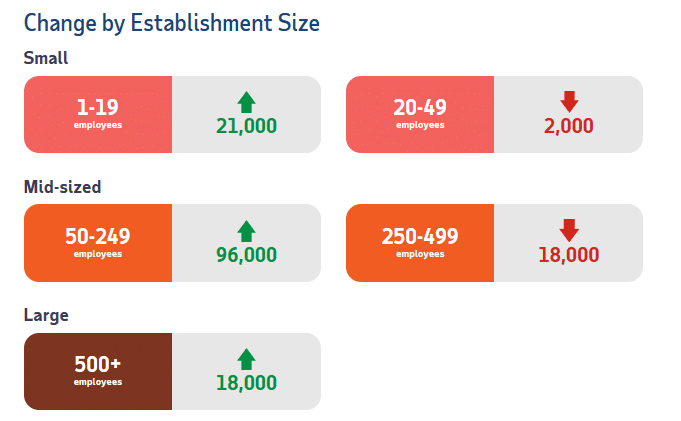
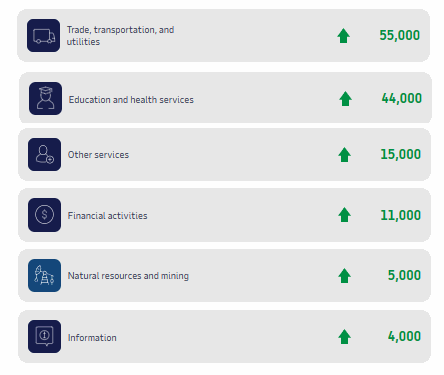
ADP Job Gainers
According to ADP, six sectors gained employees in November.
ADP Job Losers
And 4 sectors lost employees.
BLS: November 2023 Employment by Sector
The BLS employment “bubble chart” gives us a slightly different picture than the ADP does. The Bubble’s Size tells us the total Employment for that industry (i.e., larger bubbles mean more people are employed in that sector).
The bubble’s location on the chart tells us that there has been a change in Employment Levels over the most recent month… A bubble further to the right indicates larger job growth. A bubble’s vertical location on the chart shows the average industry salary.
Remember, these are Seasonally Adjusted Numbers, so they aren’t cumulative!
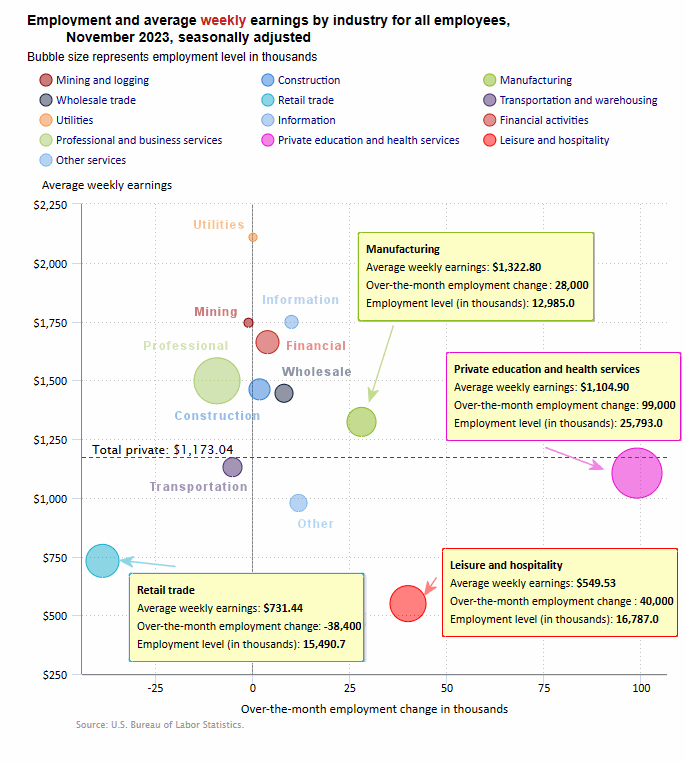
According to the BLS Leisure and Hospitality added 40,000 jobs. And surprisingly Retail which usually gains employees in November instead lost -38,400 jobs! However, we need to remember that these are “seasonally adjusted jobs” meaning that since retail usually gains jobs in November this year was just -38,400 less than normal which may or may not be a real decrease in jobs.
BLS Average Weekly Wages
| Date | Average Weekly Wage |
| November 2023 | $1,173.04 |
| October 2023 | $1,166.20 |
| September 2023 | $1,165.47 |
| August 2023 | $1,163.41 |
| July 2023 | $1,157.28 |
| June 2023 | $1,155.15 |
| May 2023 | $1,146.99 |
| April 2023 | $1,147.58 |
| March 2023 | $1,141.34 |
| February 2023 | $1,141.61 |
| January 2023 | $1,146.14 |
| December 2022 | $1,125.73 |
| November 2022 | $1,129.01 |
| October 2022 | $1,124.01 |
| September 2022 | $1,119.87 |
| August 2022 | $1,116.42 |
| July 2022 | $1,116.54 |
| June 2022 | $1,106.76 |
| May 2022 | $1,105.47 |
| April 2022 | $1,102.01 |
| December 2021 | $1,086.46 |
BLS Employment and Average Weekly Earnings by Industry
November 2023, Seasonally Adjusted Employment
Note: A major factor in the gain in the Manufacturing sector was the end of the Auto Workers strike.
We’ve added a column to the table below showing the employment levels the BLS reported the previous month. Note that due to “seasonal adjusting,” although they may claim that there was a “monthly increase” (or decrease), there isn’t always an actual increase; you can’t just subtract last month’s “employment level” from this month’s level. For instance, Total Private employment was supposed to have increased by 150,000 in November but November had 134,120,000 and October had 134,031,000 which looks more like an 89,000 gain.
| Industry | Nov. Monthly Increase | Nov. Ave. Weekly Earnings | Nov. Employment Level | Oct. Employment Level |
| Total Private Employment | 150,000 | $1,173.04 | 134,120,000 | 134,031,000 |
| Mining and Logging | -1,000 | $1,744.72 | 644,000 | 646,000 |
| Construction | 2,000 | $1,461.17 | 8,033,000 | 8,033,000 |
| Manufacturing | 28,000 | $1,322.80 | 12,985,000 | 12,960,000 |
| Wholesale trade | 8,300 | $1,444.52 | 6,100,400 | 6,090,700 |
| Retail trade | -38,400 | $731.44 | 15,490,700 | 15,546,100 |
| Transportation and Warehousing | -5,000 | $1,130.05 | 6,680,800 | 6,686,200 |
| Utilities | 100 | $2,108.39 | 561,100 | 560,700 |
| Information | 10,000 | $1,748.16 | 3,025,000 | 3,027,000 |
| Financial Activities | 4,000 | $1,662.06 | 9,152,000 | 9,153,000 |
| Professional and Business Services | -9,000 | $1,497.60 | 22,971,000 | 23,027,000 |
| Private Education and Health Services | 99,000 | $1,104.90 | 25,793,000 | 25,692,000 |
| Leisure and Hospitality | 40,000 | $549.53 | 16,787,000 | 16,722,000 |
| Other Services | 12,000 | $977.72 | 5,897,000 | 5,887,000 |
Source: BLS
Unemployment
November’s Seasonally Adjusted Unemployment is 3.7% down from 3.8% in August & September and 3.9% in October.
 November’s Labor Force Participation Rate
The LFPR is 62.8% up from 62.7%.
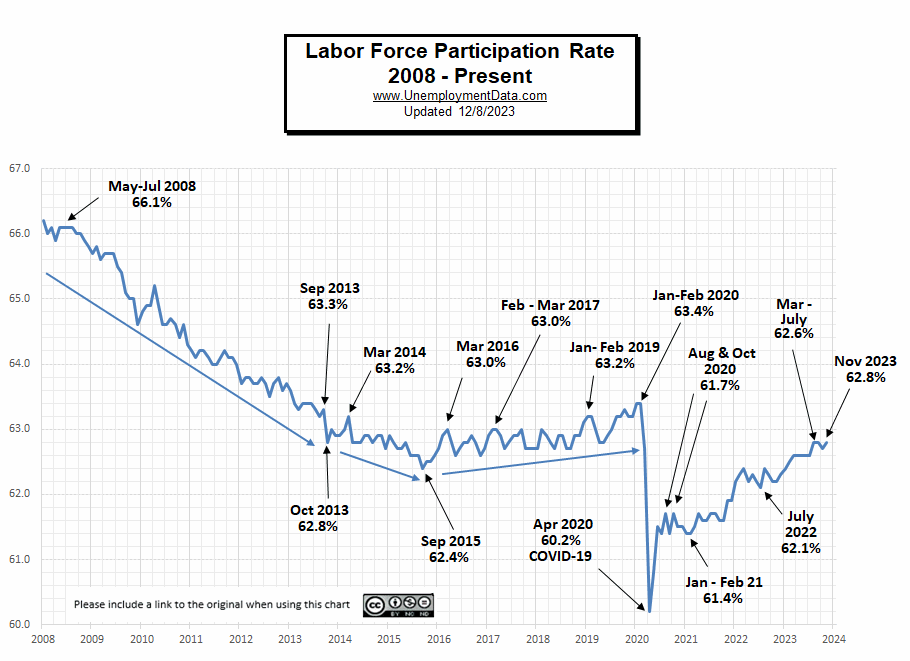 See Labor Force Participation Rate for more information.
Still Near Full Employment
This chart compares employment levels with the (inverted) unemployment rate.
Full Employment is when everyone who wants a job has one. It is generally considered to be around 3%. After the unemployment rate almost touched the magic full employment line in April, it began moving away (i.e., higher unemployment). But in November it ticked closer again.
Note: The Unemployment rate is inverted to track the employment rate. Neither is Seasonally Adjusted. For more information see Employment vs. Unemployment.
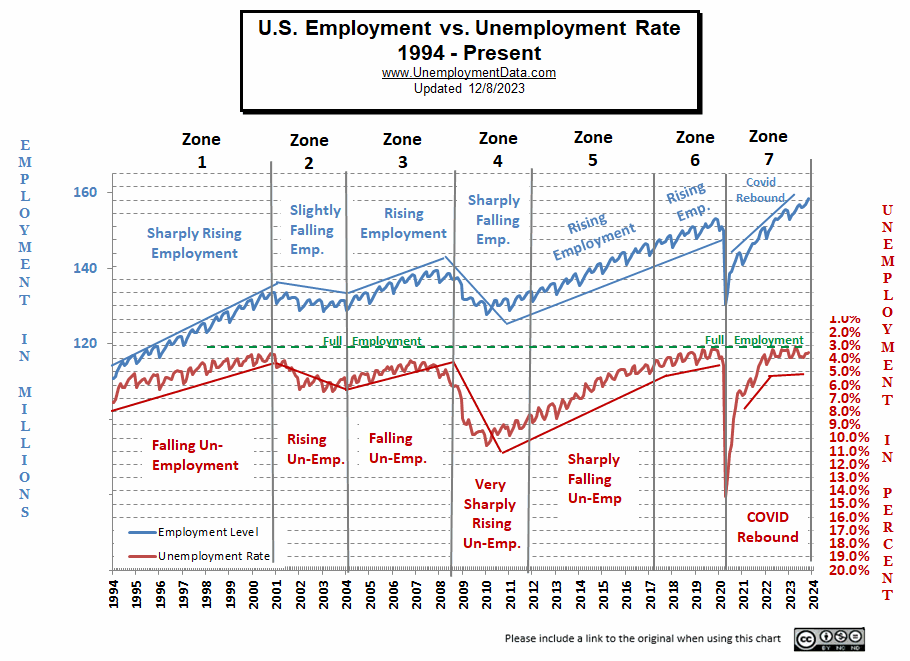
Note: Full employment is not considered to be at zero percent because even when employers are having difficulty finding employees, some people are still unemployed due to either structural unemployment (mismatch between worker skills and job requirements, i.e., not enough training) or simply because they quit their job knowing it would be easy to find another (hopefully better) job. Often referred to as frictional unemployment (there will always be people who have quit or have lost a seasonal job and are in the process of getting a new job).
Seasonally Adjusted U1 through U6 Unemployment Rates
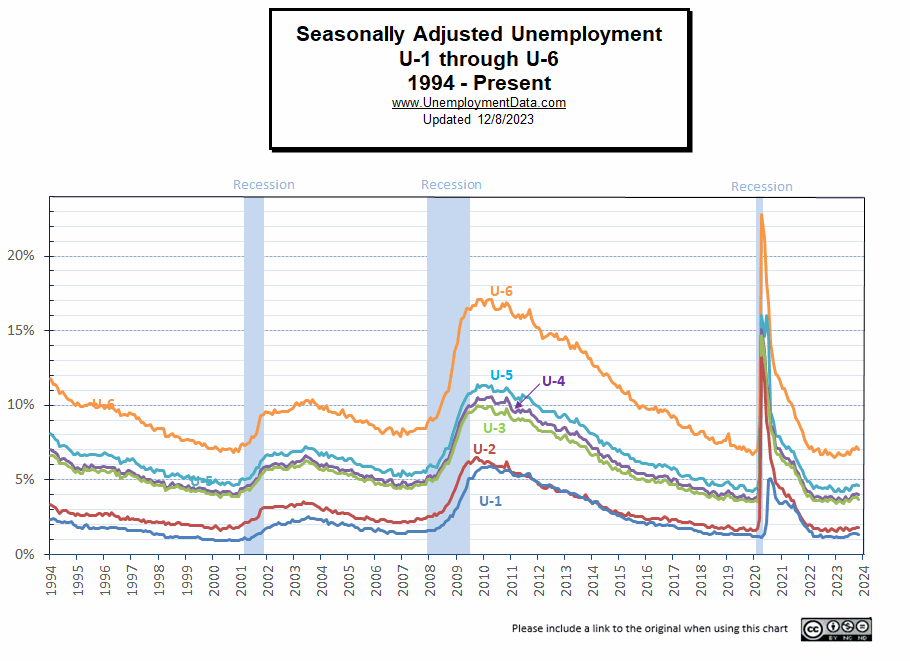 For more information about the various measurements of unemployment, see What Is U-6 Unemployment?
Seasonally Adjusted Unemployment by Education
Despite the other numbers indicating a healthy jobs market, unemployment by the less educated has been rising indicating potential weakness.
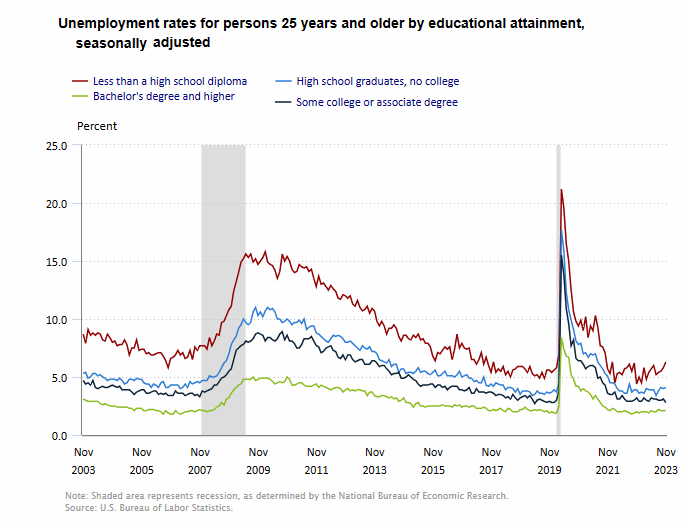 Source: BLS
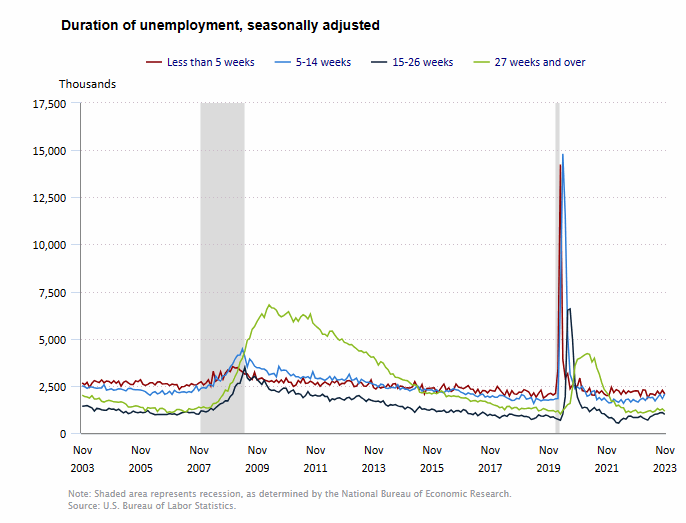
Duration of Unemployment
Although 15-26 week unemployment shows some signs of weakness it hasn’t bled over into 27 weeks and longer yet.
Employment-Population Ratio
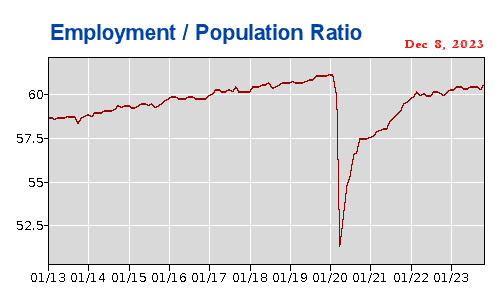
The Employment / Population ratio rose from 60.2% of the population employed in October to 60.5% in November, still below the pre-pandemic levels.
See Employment Population Ratio for more information.
Read more on UnemploymentData.com.
- 10 Job Hazards Everyone Should Watch Out For No Matter Their Industry
- Unemployment by State
- 5 Powerful Ways to Find Your Next Job Online
- Signs of a Great (and Not So Great) Staffing Agency
From InflationData.com
- Inflation Adjusted Mortgage Rates
- October 2023 Inflation Shrinks
- The Source of the Eurozone’s Economic Woes
- The Great Phony Disinflation
- How Germany is Fudging Their Inflation Numbers
From Financial Trend Forecaster
- Moore Inflation Predictor
- NYSE ROC
- NASDAQ ROC
- The Fed Is Draining Our Economy Like Farmers Have Drained Their Aquifers
- If the Economy Is So Great, Why Are Tax Revenues So Weak?
- Bidenomics: Boom or Bust?
- Could a Hamas vs. Israel War Trigger a Worldwide Recession?
- The Dangerous Myth of a “Soft Landing”
- The Crux of China’s Problems
- Mini-Manias: Beware Short-Term Trading Frenzies – Like This One
- Why You Should Expect a Once-in-a-Lifetime Debt Crisis
- Why Do Traders Really Lose Money?
- Quick Takes on Big Financial Trends
- Extremely Rare Market Signal Just Triggered
From OptioMoney.com
- Financial Resilience in Uncertain Times
- Moving Abroad on a Budget:
- Give Your Brand the Refresh It Deserves
- DIY vs. Professional Movers
- 7 Ways to Increase the Value of Your Home
From Your Family Finances