The Bureau of Labor Statistics released its employment report (broken down by state) for the month of December 2022.
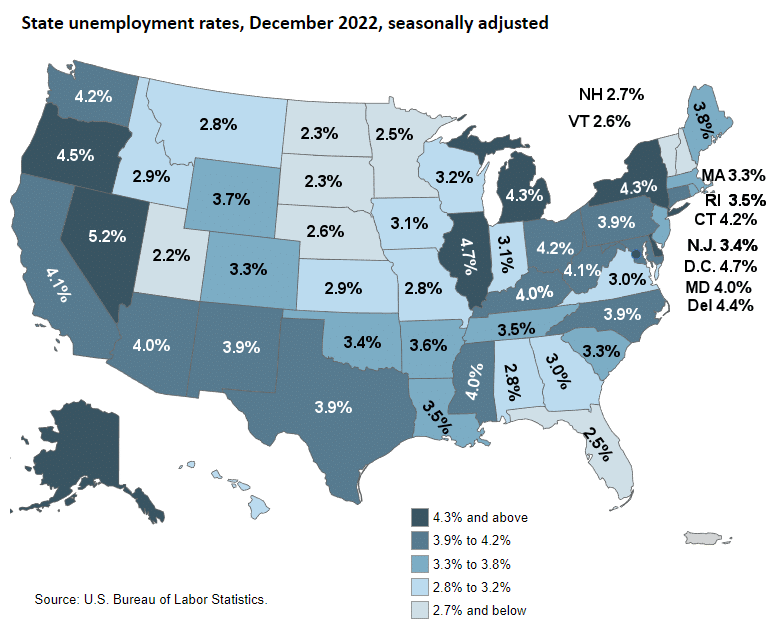
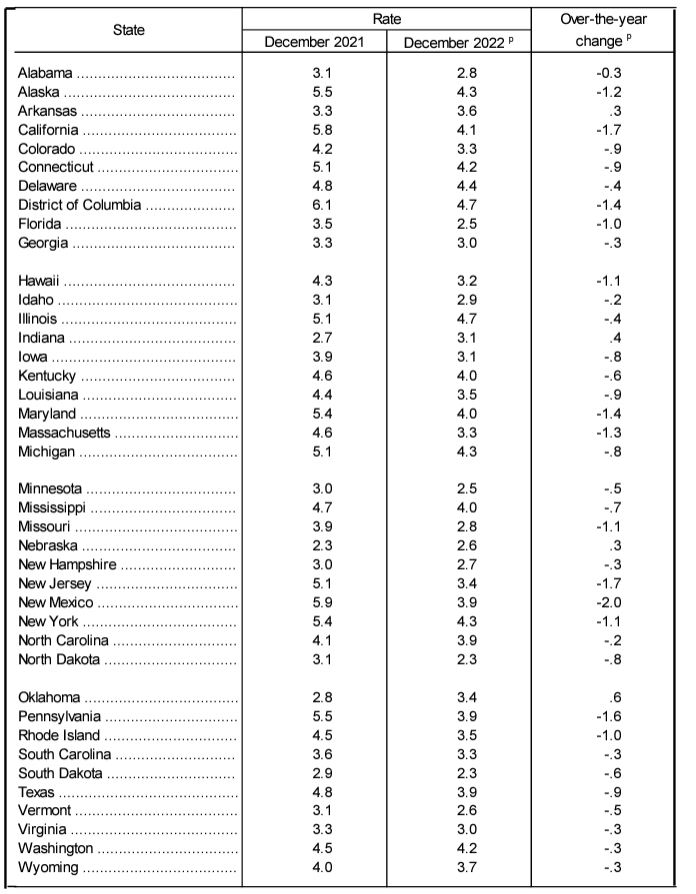
The lowest jobless rate was in Utah at 2.2 percent. North and South Dakota had the next lowest rates at 2.3 percent each. Alaska at 4.3%, and Pennsylvania at 3.9% set record lows since the BLS began recording (by state) in 1976. Nevada had the highest unemployment rate, 5.2 percent. 14 states had unemployment rates lower than the U.S. average of 3.5 percent. Washington D.C. and 11 states had rates higher than average, and 25 states had rates that were not appreciably different from that of the nation.
In December, seven states had over-the-month unemployment rate increases, the largest of which was in Nevada (+0.3 percentage point). Five states had over-the-month decreases, the largest of which was in Maryland (-0.3 percentage point). Thirty-eight states and the District of Columbia had jobless rates that were not notably different from those of a month earlier, though some had changes that were at least as large numerically as the significant changes.
Unemployment Rates for States Ranked
| State | December 2022 | Rank |
|---|---|---|
|
Utah |
2.2 | 1 |
|
North Dakota |
2.3 | 2 |
|
South Dakota |
2.3 | 2 |
|
Florida |
2.5 | 4 |
|
Minnesota |
2.5 | 4 |
|
Nebraska |
2.6 | 6 |
|
Vermont |
2.6 | 6 |
|
New Hampshire |
2.7 | 8 |
|
Alabama |
2.8 | 9 |
|
Missouri |
2.8 | 9 |
|
Montana |
2.8 | 9 |
|
Idaho |
2.9 | 12 |
|
Kansas |
2.9 | 12 |
|
Georgia |
3.0 | 14 |
|
Virginia |
3.0 | 14 |
|
Indiana |
3.1 | 16 |
|
Iowa |
3.1 | 16 |
|
Hawaii |
3.2 | 18 |
|
Wisconsin |
3.2 | 18 |
|
Colorado |
3.3 | 20 |
|
Massachusetts |
3.3 | 20 |
|
South Carolina |
3.3 | 20 |
|
New Jersey |
3.4 | 23 |
|
Oklahoma |
3.4 | 23 |
|
Louisiana |
3.5 | 25 |
|
Rhode Island |
3.5 | 25 |
|
Tennessee |
3.5 | 25 |
|
Arkansas |
3.6 | 28 |
|
Wyoming |
3.7 | 29 |
|
Maine |
3.8 | 30 |
|
New Mexico |
3.9 | 31 |
|
North Carolina |
3.9 | 31 |
|
Pennsylvania |
3.9 | 31 |
|
Texas |
3.9 | 31 |
|
Arizona |
4.0 | 35 |
|
Kentucky |
4.0 | 35 |
|
Maryland |
4.0 | 35 |
|
Mississippi |
4.0 | 35 |
|
California |
4.1 | 39 |
|
West Virginia |
4.1 | 39 |
|
Connecticut |
4.2 | 41 |
|
Ohio |
4.2 | 41 |
|
Washington |
4.2 | 41 |
|
Alaska |
4.3 | 44 |
|
Michigan |
4.3 | 44 |
|
New York |
4.3 | 44 |
|
Delaware |
4.4 | 47 |
|
Oregon |
4.5 | 48 |
|
District of Columbia |
4.7 | 49 |
|
Illinois |
4.7 | 49 |
|
Nevada |
5.2 | 51 |
Unemployment Rates for States (Alphabetical)
| State | December 2022 | Rank |
| Alabama | 2.8 | 9 |
| Alaska | 4.3 | 44 |
| Arizona | 4 | 35 |
| Arkansas | 3.6 | 28 |
| California | 4.1 | 39 |
| Colorado | 3.3 | 20 |
| Connecticut | 4.2 | 41 |
| Delaware | 4.4 | 47 |
| District of Columbia | 4.7 | 49 |
| Florida | 2.5 | 4 |
| Georgia | 3 | 14 |
| Hawaii | 3.2 | 18 |
| Idaho | 2.9 | 12 |
| Illinois | 4.7 | 49 |
| Indiana | 3.1 | 16 |
| Iowa | 3.1 | 16 |
| Kansas | 2.9 | 12 |
| Kentucky | 4 | 35 |
| Louisiana | 3.5 | 25 |
| Maine | 3.8 | 30 |
| Maryland | 4 | 35 |
| Massachusetts | 3.3 | 20 |
| Michigan | 4.3 | 44 |
| Minnesota | 2.5 | 4 |
| Mississippi | 4 | 35 |
| Missouri | 2.8 | 9 |
| Montana | 2.8 | 9 |
| Nebraska | 2.6 | 6 |
| Nevada | 5.2 | 51 |
| New Hampshire | 2.7 | 8 |
| New Jersey | 3.4 | 23 |
| New Mexico | 3.9 | 31 |
| New York | 4.3 | 44 |
| North Carolina | 3.9 | 31 |
| North Dakota | 2.3 | 2 |
| Ohio | 4.2 | 41 |
| Oklahoma | 3.4 | 23 |
| Oregon | 4.5 | 48 |
| Pennsylvania | 3.9 | 31 |
| Rhode Island | 3.5 | 25 |
| South Carolina | 3.3 | 20 |
| South Dakota | 2.3 | 2 |
| Tennessee | 3.5 | 25 |
| Texas | 3.9 | 31 |
| Utah | 2.2 | 1 |
| Vermont | 2.6 | 6 |
| Virginia | 3 | 14 |
| Washington | 4.2 | 41 |
| West Virginia | 4.1 | 39 |
| Wisconsin | 3.2 | 18 |
| Wyoming | 3.7 | 29 |
States with Statistically Significant Changes in Unemployment for 2021 to 2022
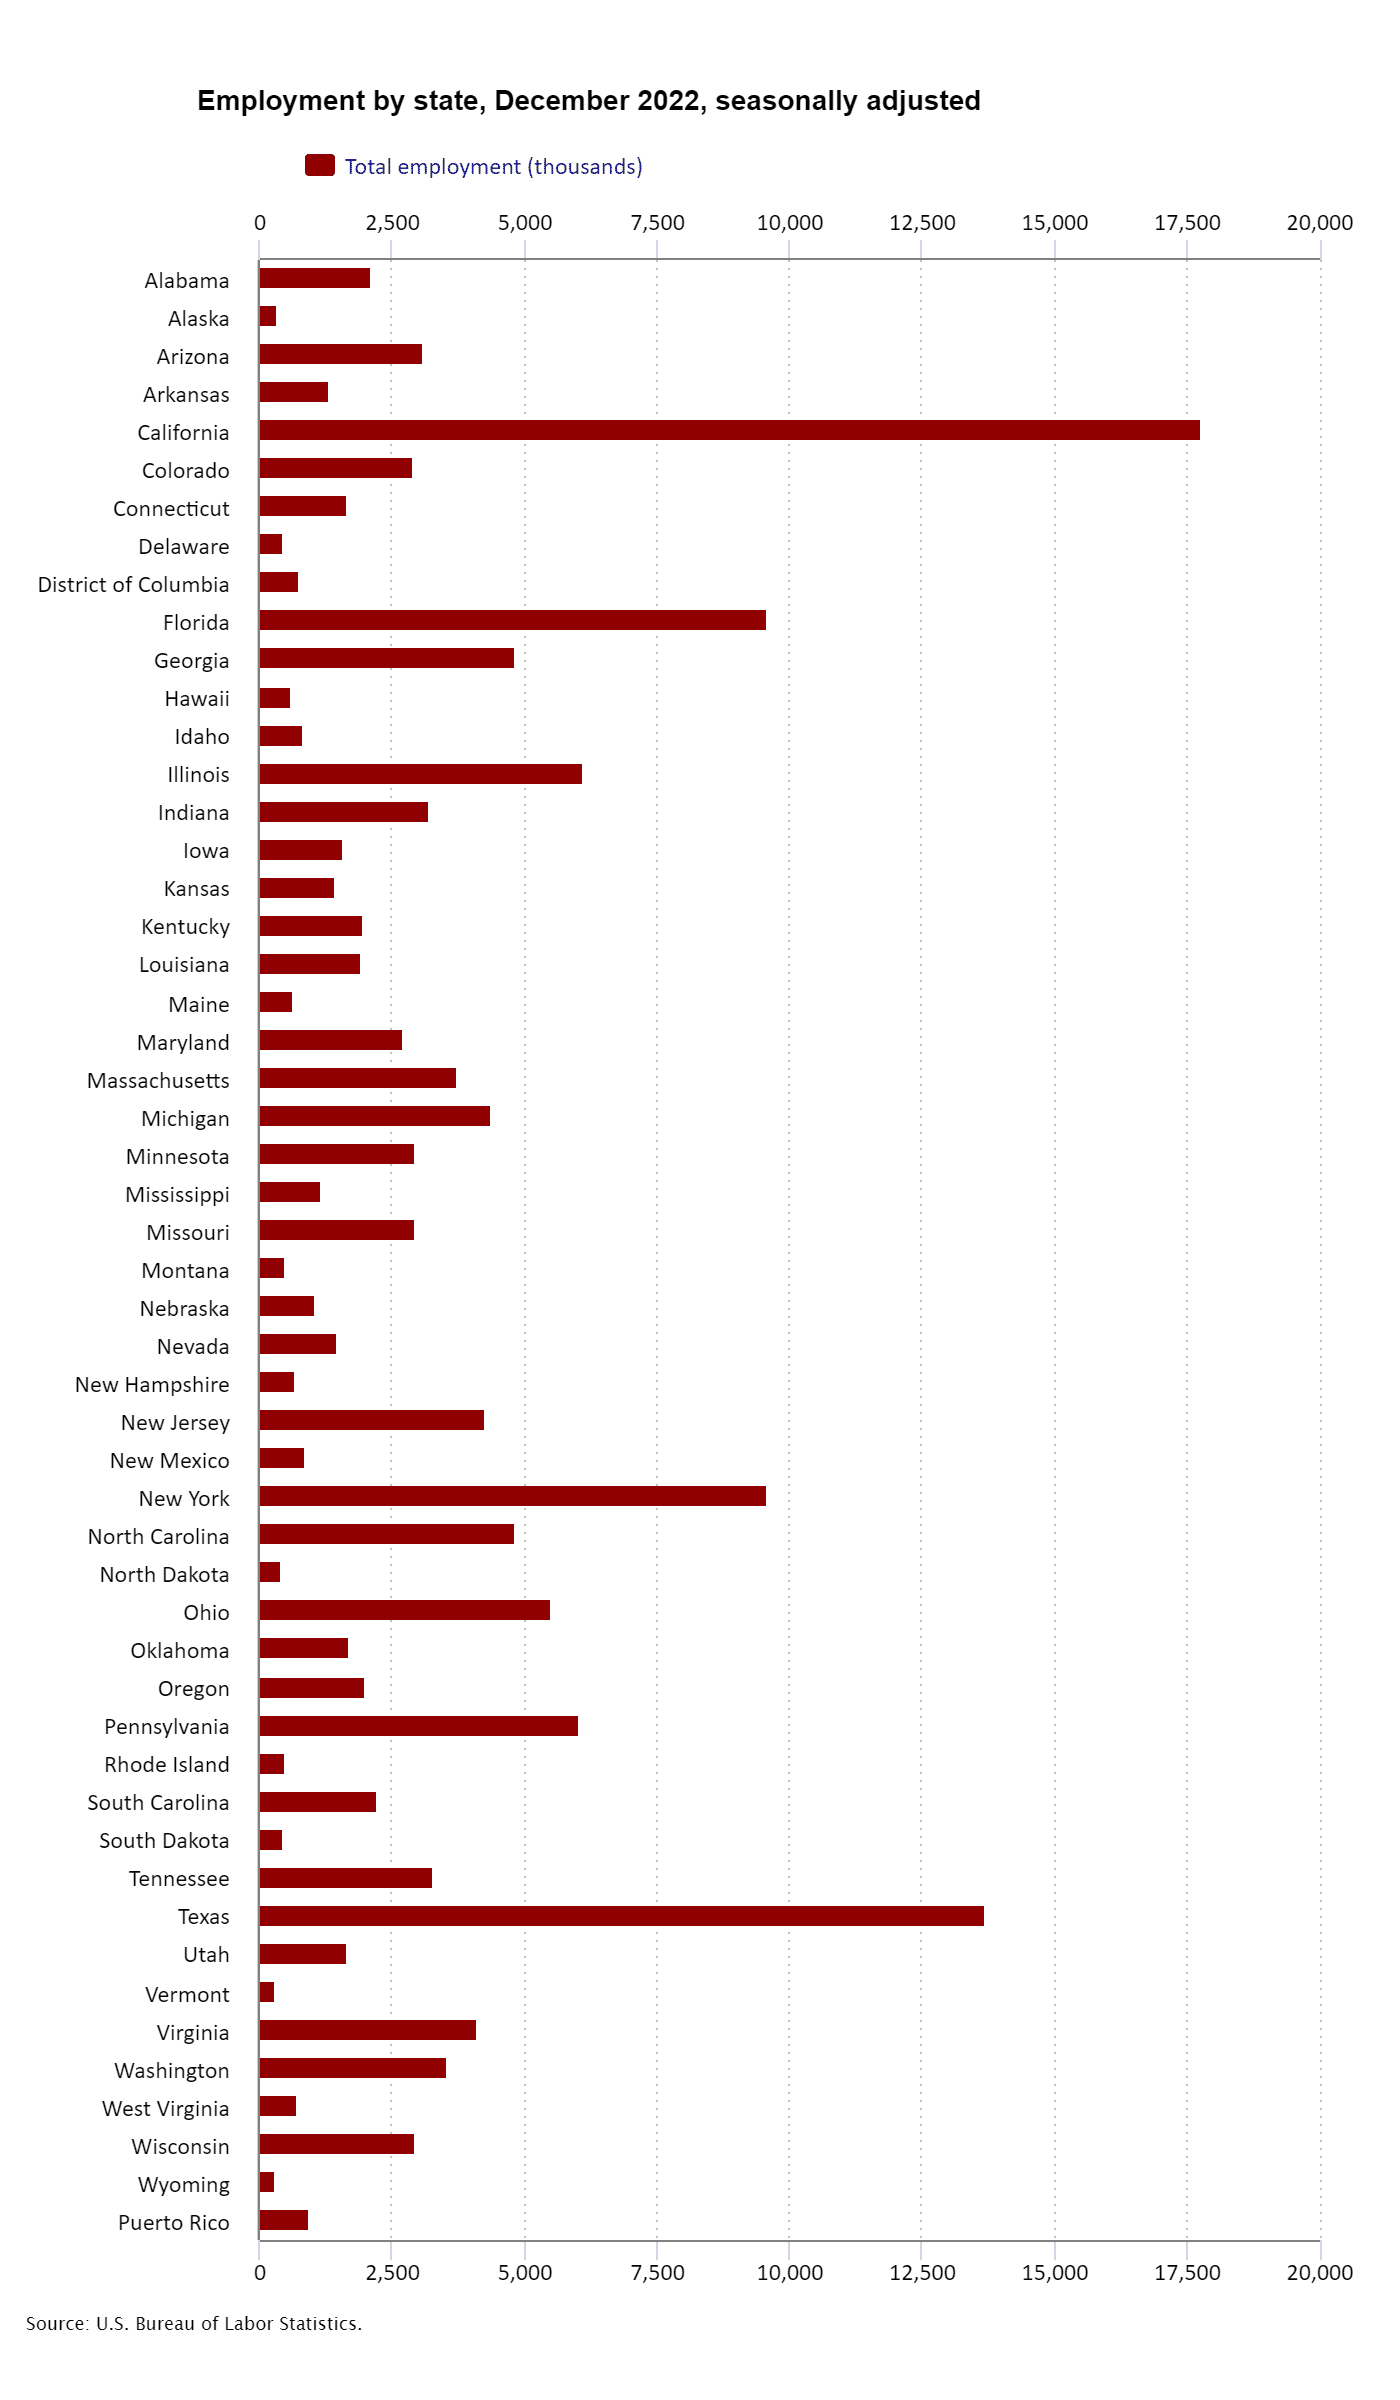
Employment by State


