
The US economy added 160,000 “seasonally adjusted” jobs in April, the lowest figure in the last seven months. The adjusted U-3 unemployment rate remained steady at 5%. The Unadjusted U-3 fell to 4.7% while the Unadjusted U-6 fell to 9.3% from 9.9% last month.
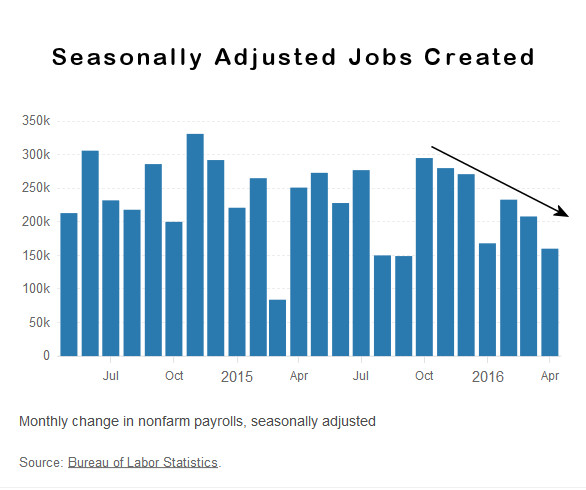 On a seasonally adjusted basis employment has fallen while on a non-adjusted basis the actual number of non-farm employed has increased from 142.887 Million to 143.944 million for a net increase of 1,057,000 jobs but since April traditionally sees a large increase in seasonal workers the seasonally adjusted number says that we were only 160,000 jobs better than what we would expect if there were zero jobs growth.
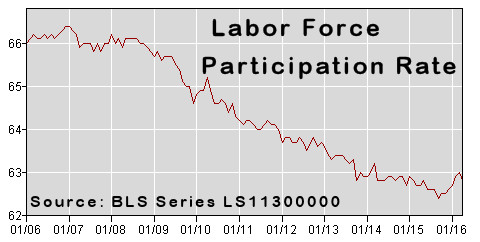
Labor Force Participation Rate
The Labor Force Participation Rate (LFPR) is the percentage of the Labor Force that is currently either looking for a job or actually has one. So even though it sounds like it is talking about how many people are working it actually is the percentage who “want to work”. As of April this stands at 62.8%. This rate has been steadily falling for a number of years and has reached levels not seen since the 1970’s.
Since the Bureau of Labor Statistics measures unemployment as the percentage of the labor force that can’t find work as people stop looking for work they fall out of the labor force and are no longer counted. Thus the unemployment rate can fall even though no new jobs have been created.
Long Term Labor Force Participation Rate
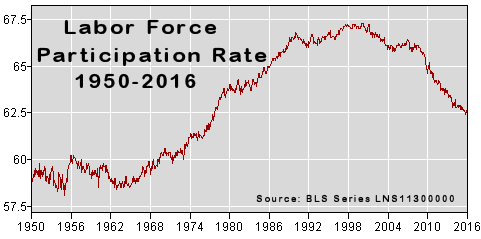 As we can see from the above chart the LFPR peaked in the late 1990’s and fell during the recession from 2000 through 2004. From 2004 through 2007 it leveled off but then the “Great Recession” hit and the LFPR has fallen pretty steadily since. And even though we are supposed to be in a recovery the LFPR continues to fall although there was a bit of an up tick at the end of 2015 and early 2016, April’s LFPR is lower than March’s.
Some people wrongly assume that the LFPR is falling due to retiring baby-boomers. This premise however has been proven false. See Record Low LFPR which shows the LFPR by age group since 1999. The biggest declines occur in the younger ages while those above age 60 actually show a higher percentage are working. For instance, in 1999 only 24% of those age 65-69 were working but according to the BLS in 2015 30.8% of those age 65-69 were working.
Gallup “Good Jobs” Index
Gallup’s “Good Jobs” Index is their version of the LFPR it is calculated as a percentage of the total population rather than limiting it to the “work force”. So although the percentage is lower it is a better indicator of the actual situation since it is not subject to fudging through simply redefining who is in the “work force”. Gallup says 44.9% of the total adult population is in the “Good Jobs” Index i.e. has a full-time job. This does not mean that they are employed at their full capacity or that they are earning a “decent wage” simply that they are employed full-time. Gallup defines a full-time as 30+ hours per week for an employer who provides a regular paycheck. This is up from 44.5% last month confirming the seasonal increase in employment mentioned above.