• About WordPress
    • WordPress.org
    • Documentation
    • Learn WordPress
    • Support
    • Feedback
  • Log In
  • Skip to primary navigation
  • Skip to main content
  • Skip to primary sidebar
  • Home
  • Contact us
  • Related Sites
    • InflationData.com
    • Financial Trend Forecaster
    • Your Family Finances
    • Elliott Wave University
    • Optio Money
  • About
    • Terms of Use
    • Disclaimer & Disclosure
    • Privacy Statement
  • Sitemap
    • 2009-2010 Posts
    • 2011 Posts

UnemploymentData.com

Your Source for Employment and Unemployment Data

Unemployment
  • Charts
    • Current Unemployment Rate Chart
    • Current Employment (Chart and Data)
    • Current Employment vs Unemployment Chart
    • Historical Employment Data
    • Employment Population Ratio
    • Misery Index
  • Unemployment
    • Historical Unemployment Rate Tables
    • What Is U-6 Unemployment?
    • Unadjusted vs. Seasonally Adjusted U-3 Unemployment Rate
    • BLS vs. Gallup Unemployment Numbers
    • Current U-6 Unemployment Rate
    • What is the Labor Force Participation Rate?
    • What is the Real Unemployment Rate?
  • Employment
    • Current Employment (Chart and Data)
    • Historical Employment Data
    • Contacting a Live Person at the State Employment Commission
      • How to Talk to a Live Person at the Virginia Unemployment Commission
      • Florida’s FLUID Unemployment Program
    • Benefits
      • Insurance
      • Retirement
    • Careers
    • Employment Costs
    • Experience
    • Government
    • Job Hunting
      • Interview
      • Resume
  • Find Articles
  • Education
    • Skills
  • General
    • Small Business
      • Outsourcing
    • Success
You are here: Home / General / BLS Releases Unemployment Rates for April

BLS Releases Unemployment Rates for April

May 9, 2015 by Tim McMahon

The U.S. Bureau of Labor Statistics released the Employment and Unemployment rates for the month of April 2015 on Friday May 8th.  The commonly quoted Seasonally Adjusted U-3 Unemployment rate was 5.4% down slightly from 5.5% in both February and March.

The unadjusted U3 was 5.1% while the broader unadjusted U6 (which takes into account those who have given up looking for work and those who are working part-time but would prefer to work full-time) was at 10.4%.

The independently calculated Gallup equivalent of the unadjusted U3 was significantly higher at 5.9% (see BLS vs Gallup). Gallup also calculates the U6 equivalent at 14.8% that is 4.4% higher than the BLS. In addition, Gallup calculates that only 43.9% of the population is working down from 44.2% a month earlier.

The BLS commissioner reported an increase of 223,000 jobs in April, but had reported an increase of 126,000 jobs in March only to adjust that number down by 39,000 jobs this month. So after removing almost 1/3rd of March’s job increase the final job increase for March was 85,000.

Employment-2000-Apr-2015If we look at the Current Employment Data we will see that according to the BLS there were 140,284,000 employed in March up from 138,443,000 employed in January. But that is down from 141 million plus in October, November and December. April’s increase brings us back to those levels coming in at 141,462,000.

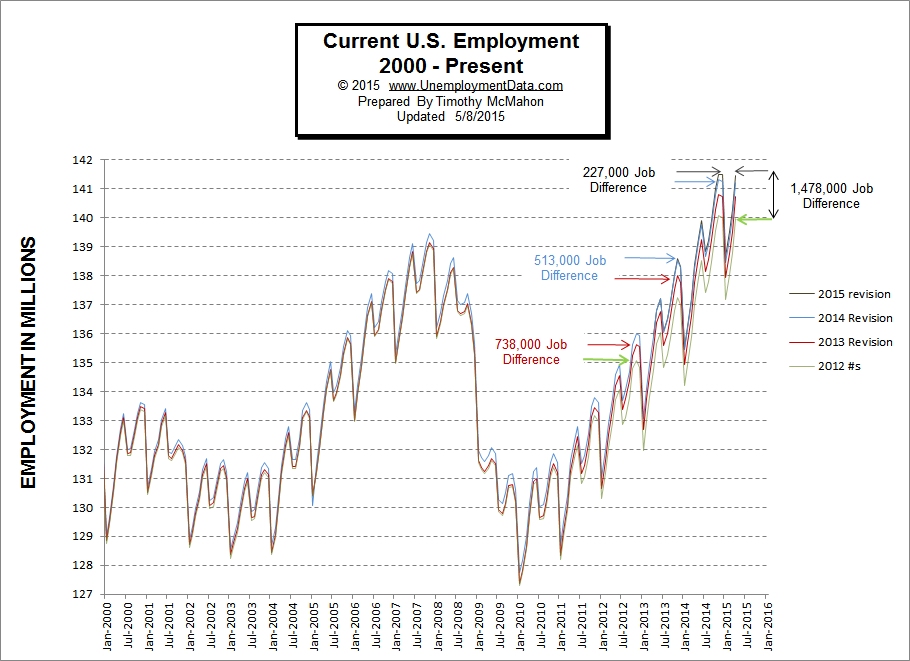
This chart shows the actual number (unadjusted) of Non-farm jobs in the United States as tracked by the U.S. Bureau of Labor statistics. Historical Employment Data Series CEU 0000000001.

Filed Under: General Tagged With: April 2015, employment, unemployment

About Tim McMahon

Work by editor and author, Tim McMahon, has been featured in Bloomberg, CBS News, Wall Street Journal, Christian Science Monitor, Forbes, Washington Post, Drudge Report, The Atlantic, Business Insider, American Thinker, Lew Rockwell, Huffington Post, Rolling Stone, Oakland Press, Free Republic, Education World, Realty Trac, Reason, Coin News, and Council for Economic Education. Connect with Tim on Google+

Primary Sidebar

Rate Any Stock In Seconds

Get a detailed stock report showing its true value, safety score, and ideal timing to buy. Plus, receive a color coded Buy, Sell, or Hold recommendation.

Get Your Free Stock Analysis Here.

Recent Posts

  • February Employment Report for January 2026
  • Unemployment Report for December 2025
  • Unemployment Report for Nov. 2025
  • Delayed September 2025 Unemployment Report Released
  • No BLS Employment Data for October 2025 But ADP Says 42K New Jobs

Search Site

Resources

  • Bureau of Labor Statistics Current Population Survey Monthly survey of households conducted by the Bureau of Census for BLS. It provides data on the labor force, employment, unemployment, etc.
  • Capital Professional Services Providing web design and development and Internet marketing services
  • Elliott Wave University Using the Elliott Wave Principle to improve investment performance
  • Financial Trend Forecaster Featuring Moore Inflation Predictor, NYSE Rate of Change and NASDAQ Rate of change
  • InflationData.com Inflation calculators, databases, etc.
  • Intergalactic Web Designers Web design and development services

Articles by Category

Articles by Date

Disclaimer

At UnemploymentData.com we are not registered investment advisors and do not provide any individualized advice. Past performance is not necessarily indicative of future performance and future accuracy and profitable results cannot be guaranteed.

Privacy & Terms of Use

Privacy Statement & Terms of Use

Do Not Sell My Information

Copyright © 2026 · News Pro on Capital Professional Services, LLC. All rights reserved · Log in