
The U.S. Bureau of Labor Statistics (BLS) released its employment / unemployment report for September on October 6th, 2023.
Adjusted U3 Unemployment Unchanged
![]()
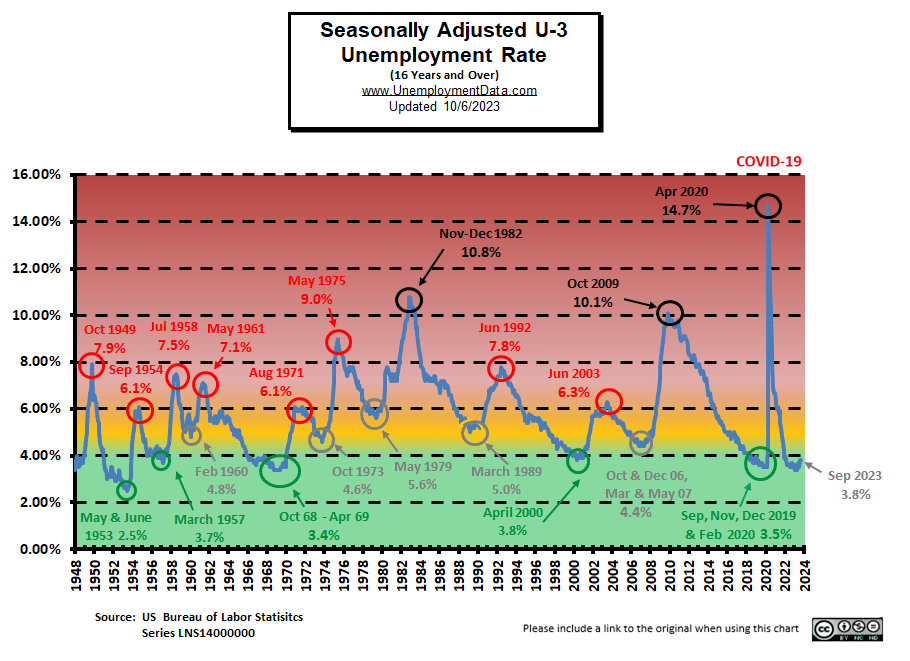
- Adjusted U-3 was 3.8% unchanged from August
- Unadjusted U-3 was 3.6% down from 3.9%
- Unadjusted U-6 was 6.7% down from 7.2%
- Labor Force Participation was 62.8% unchanged
- Unadjusted Employment rose from 156.416 to 157.001 million
Summary:
Despite the fact that the Seasonally Adjusted U3 unemployment rate was unchanged,
the UNADJUSTED U3 Rate was down… as is typical for this time of year.
Total Employed increased from 156.416 million in August to 157.001 million in September.
According to the Commissioner of the U.S. Bureau of Labor Statistics:
“Total nonfarm payroll employment rose by 336,000 in September, and the unemployment rate was unchanged at 3.8 percent, the U.S. Bureau of Labor Statistics reported today. Job gains occurred in leisure and hospitality; government; health care; professional, scientific, and technical services; and social assistance…
Among the major worker groups, the unemployment rates for adult men (3.8 percent), adult women (3.1 percent), teenagers (11.6 percent), Whites (3.4 percent), Blacks (5.7 percent), Asians (2.8 percent), and Hispanics (4.6 percent) showed little or no change in September.”
You can read the full BLS report here.
As usual, they are talking about “Seasonally Adjusted Jobs”.
Looking at the Unadjusted Establishment Survey report we see…
Originally the BLS reported employment of 156.302 million for August which they adjusted to 156.416 million. So they added 114,000 jobs for August. They are currently reporting 157.001 million jobs for September which is actually an increase of 699,000 jobs based on their original estimates or an increase of 585,000 based on their updated numbers.
BLS Source
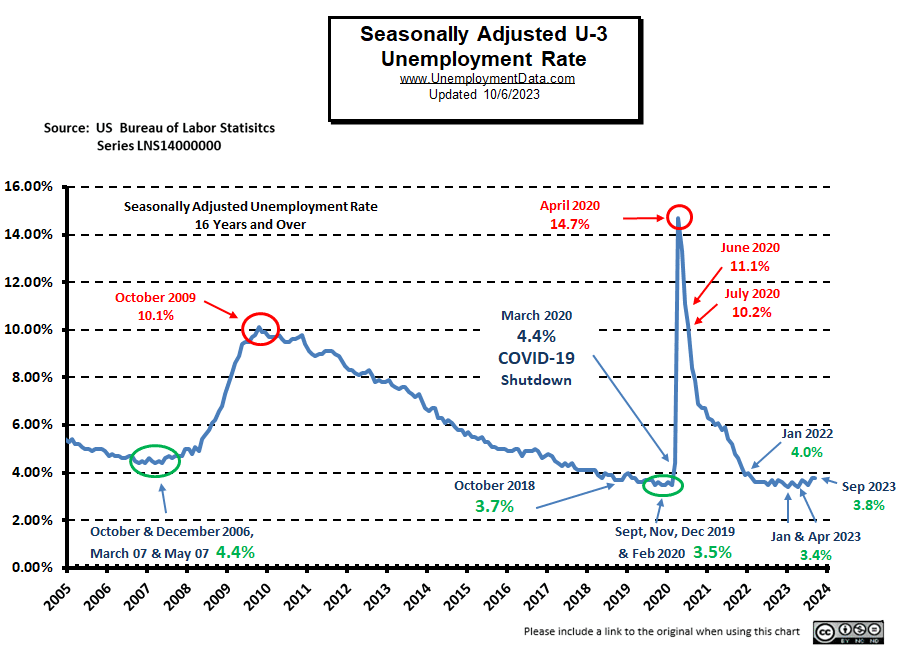
Current Employment Rate Chart
Adjusted Unemployment is slightly above the pre-COVID 2019 cyclical lows of 3.5% as well as above the lows made earlier this year. Current levels are still within the “Green Zone”.
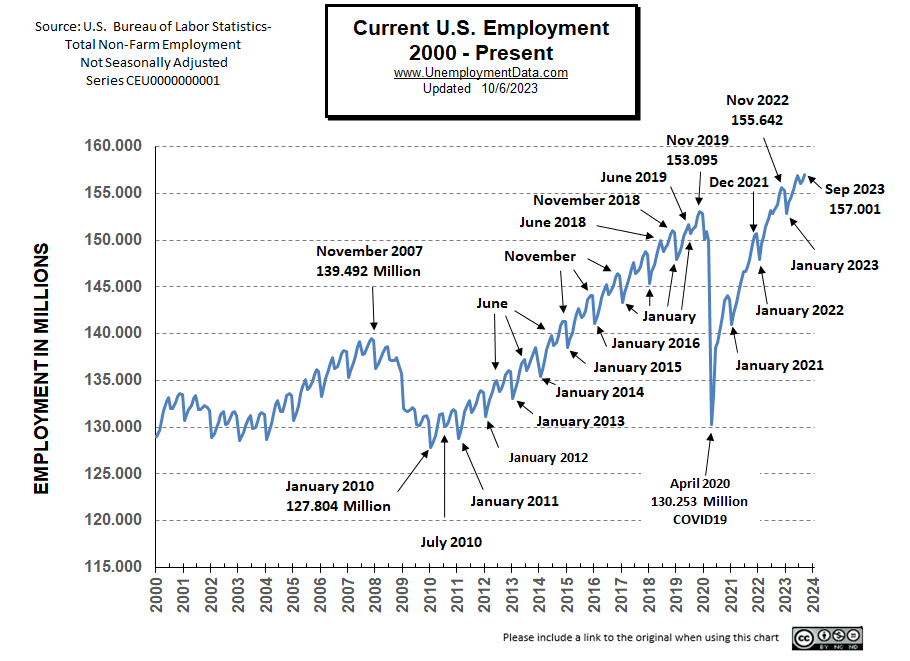
Current Employment Rate
Employment 3.192 million Above Year-Ago Levels
and 6.033 million above February 2020 (prior to the Covid Crash)
However, the Civilian Population has increased by about 7.8 million since February 2020.
In January 2023, we had the typical drop taking employment slightly below the 2019 peak. In June, employment at 156.905 million was above the November 2022 peak. And in July we got the expected slight drop to 156.126 million. August and September followed the standard pattern with September very slightly higher than June.
 See Current Employment for more information.
ADP® National Employment Report
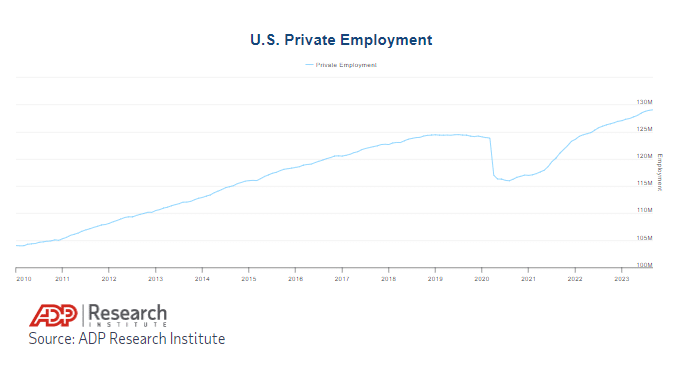
ADP provides an independent (non-government) estimate of private-sector employment and pay, based on data derived from ADP client payrolls. According to ADP®, In collaboration with Stanford Digital Economy Lab.
ADP: Private employers added 89,000 jobs in September.
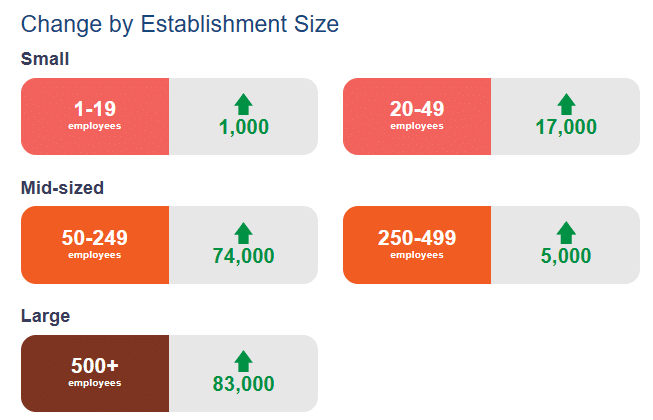
- September showed the slowest pace of growth since January 2021, when private employers shed jobs. Large establishments drove the slowdown, losing 83,000 jobs and wiping out gains they made in August.

Nela is saying that the rate of growth is slowing even though the actual number of jobs is higher than last month. Looking at the chart we can see the slightest hint that the line is leveling off, i.e., that the rate of growth is slowing.
 Source: ADP® Pay Insights
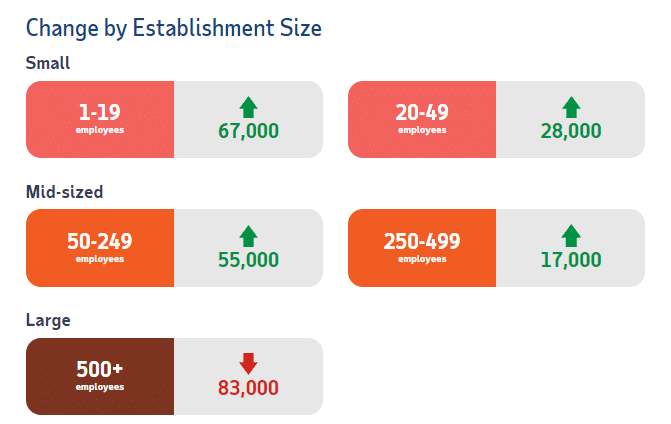
ADP Private Employment by Firm Size
ADP also lists increases by “firm size”.
This month, net job losses occurred only in large companies, losing the same amount that they gained last month.
September ADP Changes:
August ADP Changes:
ADP Job Gainers
According to ADP, seven sectors gained employees in September.

ADP Job Losers

BLS: September 2023 Employment by Sector
The BLS employment “bubble chart” gives us a slightly different picture than the ADP does. The Bubble’s Size tells us the total Employment for that industry (i.e., larger bubbles mean more people are employed in that sector).
The bubble’s location on the chart tells us that there has been a change in Employment Levels over the most recent month… A bubble further to the right indicates larger job growth. A bubble’s vertical location on the chart shows the average industry salary.
Remember, these are Seasonally Adjusted Numbers, so they aren’t cumulative!
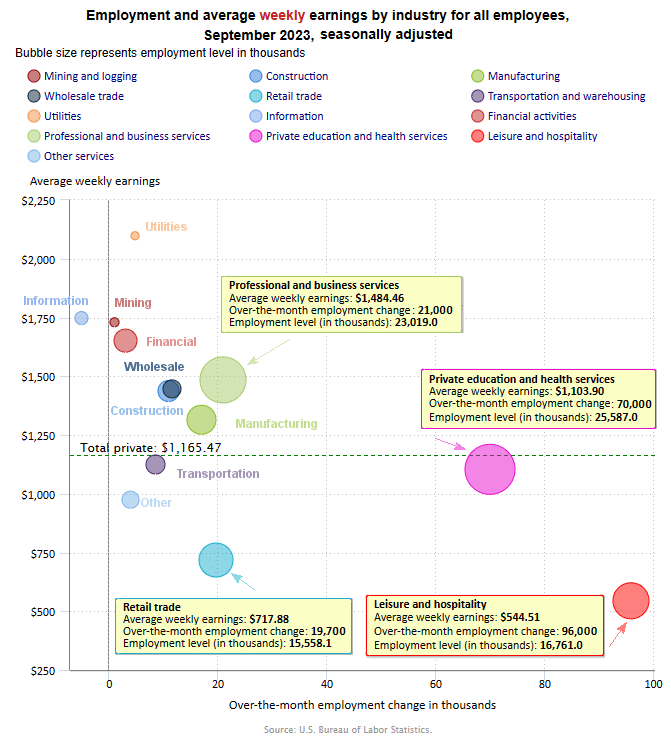
This month ADP and the BLS are relatively close in regards to Leisure and Hospitality with 92,000 and 96,000 jobs gained respectively. However, Professional and Business Services couldn’t be more different with the BLS saying they gained 21,000 jobs and ADP saying they lost 32,000 jobs. Manufacturing was also on opposite ends of the spectrum. The BLS says it gained 17,000 jobs while ADP says it lost 12,000 jobs.
BLS Average Weekly Wages
| Date | Average Weekly Wage |
| September 2023 | $1,165.47 |
| August 2023 | $1,163.41 |
| July 2023 | $1,157.28 |
| June 2023 | $1,155.15 |
| May 2023 | $1,146.99 |
| April 2023 | $1,147.58 |
| March 2023 | $1,141.34 |
| February 2023 | $1,141.61 |
| January 2023 | $1,146.14 |
| December 2022 | $1,125.73 |
| November 2022 | $1,129.01 |
| October 2022 | $1,124.01 |
| September 2022 | $1,119.87 |
| August 2022 | $1,116.42 |
| July 2022 | $1,116.54 |
| June 2022 | $1,106.76 |
| May 2022 | $1,105.47 |
| April 2022 | $1,102.01 |
| December 2021 | $1,086.46 |
BLS Employment and Average Weekly Earnings by Industry
September 2023, Seasonally Adjusted Employment
We’ve added a column to the table below showing the employment levels the BLS reported the previous month. Note that due to “seasonal adjusting,” although they may claim that there was a “monthly increase” (or decrease), there isn’t always an actual increase; you can’t just subtract last month’s “employment level” from this month’s level. For instance, Mining was supposed to have 642,000 employees in August and have a 1,000 increase, but in September, there were 645,000 employed. That looks like a 3,000 incecrease, to me. And Wholesale went from 6,070,100 in August to 6,074,500 for a seasonally adjusted 11,700 increase, but it seems like a 4,400 increase to me.
| Industry | September Monthly Increase | Sep. Ave. Weekly Earnings | Sep. Employment Level | Aug. Employment Level |
| Total Private Employment | 263,000 | $1,165.47 | 134,012,000 | 133,761,000 |
| Mining and Logging | 1,000 | $1,729.59 | 645,000 | 642,000 |
| Construction | 11,000 | $1,437.15 | 8,014,000 | 7,993,000 |
| Manufacturing | 17,000 | $1,314.88 | 13,011,000 | 12,997,000 |
| Wholesale trade | 11,700 | $1,446.08 | 6,074,500 | 6,070,100 |
| Retail trade | 19,700 | $717.88 | 15,558,100 | 15,544,900 |
| Transportation and Warehousing | 8,600 | $1,124.49 | 6,702,400 | 6,675,300 |
| Utilities | 4,800 | $2,097.94 | 563,200 | 557,300 |
| Information | -5,000 | $1,747.48 | 3,036,000 | 3,051,000 |
| Financial Activities | 3,000 | $1,651.58 | 9,157,000 | 9,158,000 |
| Professional and Business Services | 21,000 | $1,484.46 | 23,019,000 | 23,015,000 |
| Private Education and Health Services | 70,000 | $1,103.90 | 25,587,000 | 25,520,000 |
| Leisure and Hospitality | 96,000 | $544.51 | 16,761,000 | 16,655,000 |
| Other Services | 4,000 | $974.59 | 5,884,000 | 5,882,000 |
Source: BLS
Note: As usual, ADP presents an entirely different picture. See Above.
Unemployment
September’s Seasonally Adjusted Unemployment is unchanged from 3.8% in August.
 September’s Labor Force Participation Rate
The LFPR is unchanged, at 62.8%.
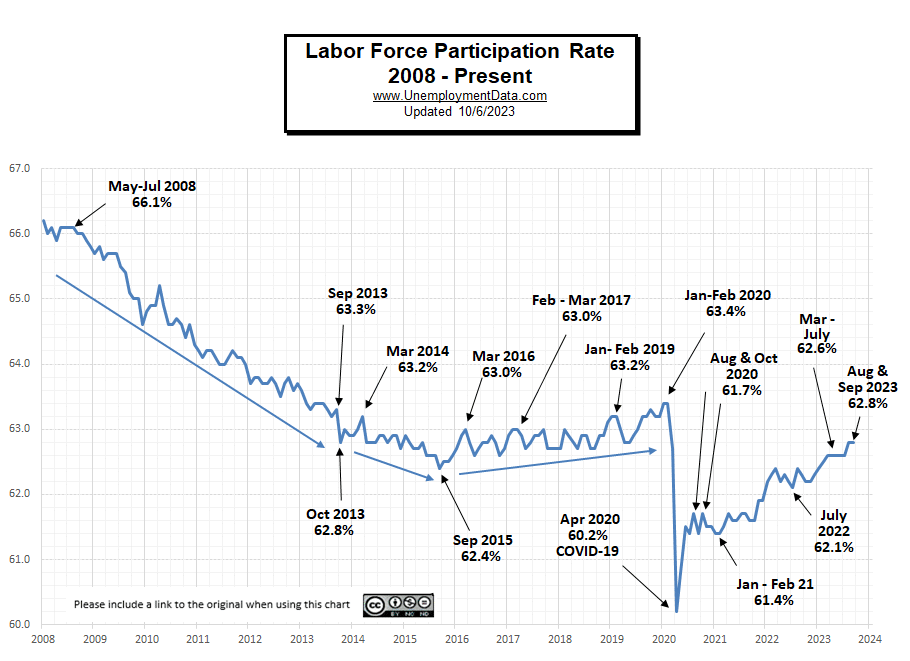 See Labor Force Participation Rate for more information.
Leaving Full Employment?
This chart compares employment levels with the (inverted) unemployment rate.
Full Employment is when everyone who wants a job has one. It is generally considered to be around 3%. After the unemployment rate almost touched the magic full employment line in April, it began moving away (i.e., higher unemployment).
Note: The Unemployment rate is inverted to track the employment rate. Neither is Seasonally Adjusted. For more information see Employment vs. Unemployment.
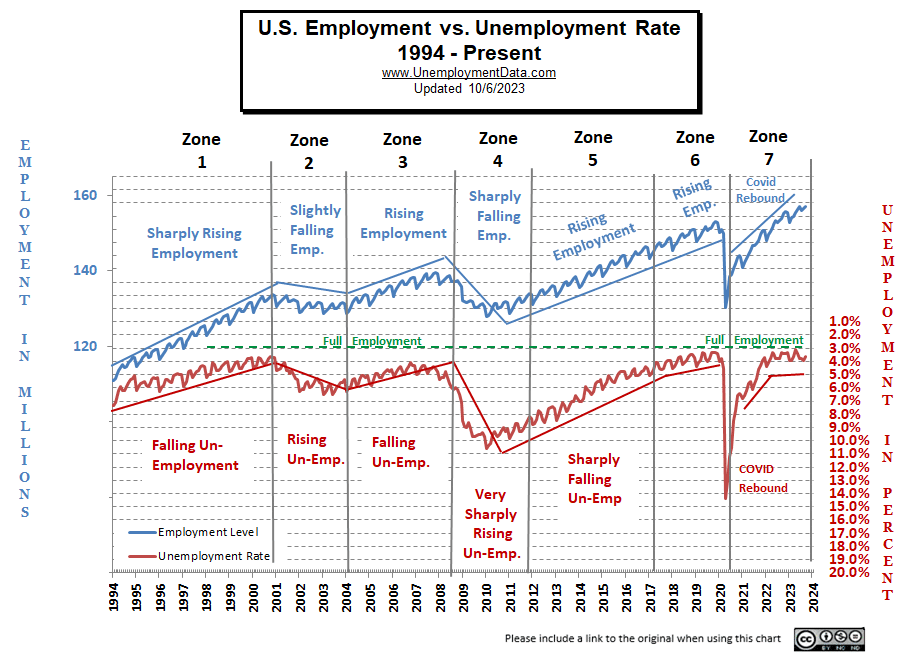
Full employment is not considered to be at zero percent because even when employers are having difficulty finding employees, some people are still unemployed due to either structural unemployment (mismatch between worker skills and job requirements, i.e., not enough training) or simply because they quit their job knowing it would be easy to find another (hopefully better) job. Often referred to as frictional unemployment (there will always be people who have quit or have lost a seasonal job and are in the process of getting a new job). See: Highly Skilled Worker Shortage in a Recession?
If the unemployment rate stays constant, but more people are working, where are these extra workers coming from?
Somehow the workforce has to be growing to accommodate these newly created jobs. They could be long-term unemployed (no longer counted in the workforce) returning to the workforce, they could be immigrants entering the workforce, or possibly retired people coming out of retirement because of an offer too good to turn down. This is generally facilitated by rising wages, but this month’s ADP report indicates that wage growth has slowed, possibly indicating that we are nearing the end of this boom.
Seasonally Adjusted U1 through U6 Unemployment Rates
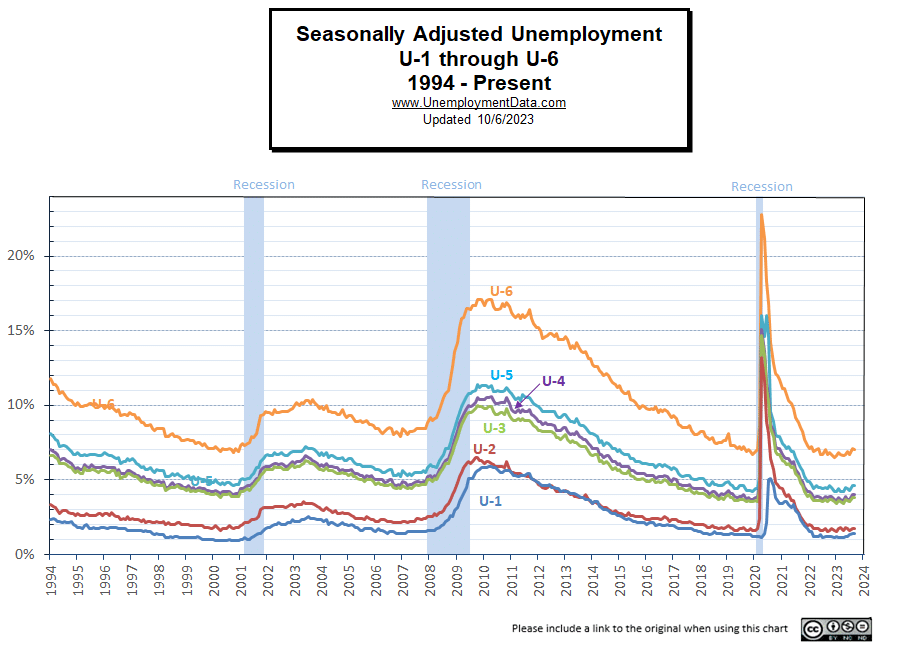 For more information about the various measurements of unemployment, see What Is U-6 Unemployment?
Seasonally Adjusted Unemployment by Education
For three months in a row, unemployment by the less educated rose, but in July it fell sharply. It rose again in August and September.
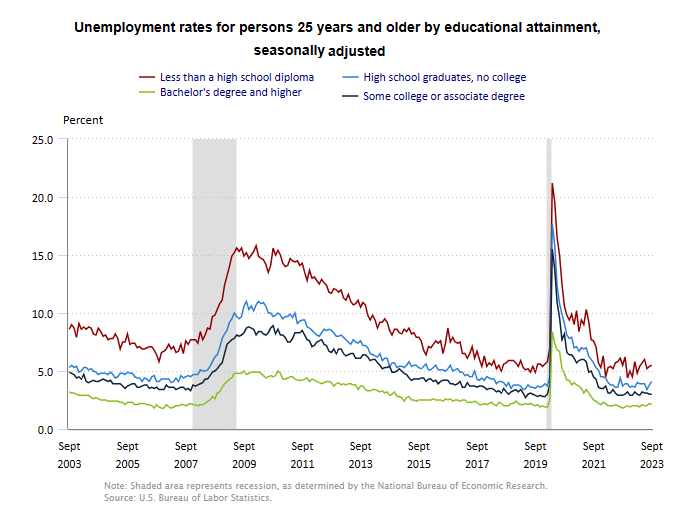 Source: BLS
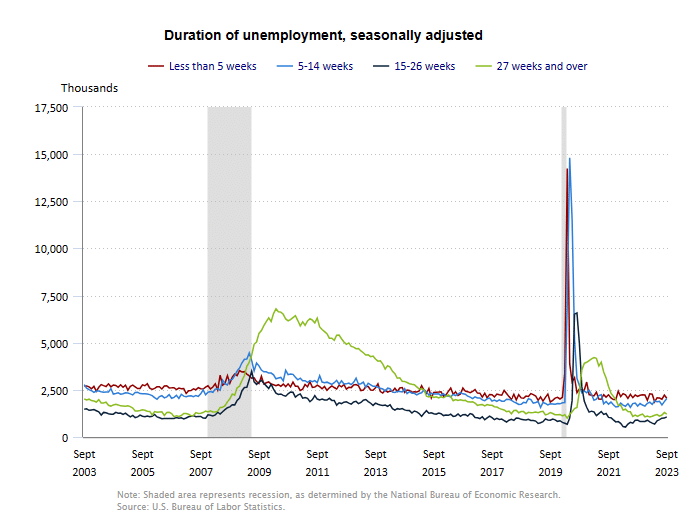
Duration of Unemployment
15-26 week unemployment ticked up again this month but Long-term unemployment (over 27 weeks) declined.
Employment-Population Ratio
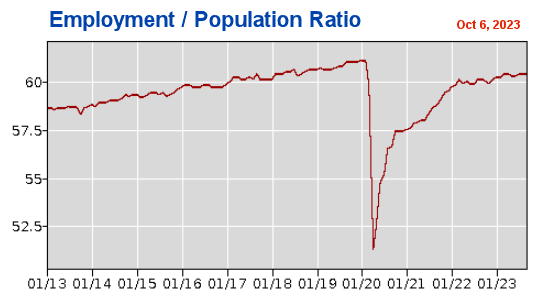
The Employment / Population ratio fell from April’s 60.4% of the population employed to 60.3% in May and June. In July & August, it was 60.4%.
See Employment Population Ratio for more information.
Read more on UnemploymentData.com.
- Getting Hired: Tips for Finding Work as a Recent College Graduate
- Is Your Job Making You Sick?
- How to Become an Owner Operator in Trucking
- Need a Change of Pace? 3 Keys to Finding a New Job Quickly
From InflationData.com
- Playing with Official Inflation Statistics: An Example from Germany
- Increasing Inflation Now Shifting Insurance Rates
- August 2023 Inflation Up Sharply
- Can the FED Engineer a “Soft Landing”?
- Inflation Is a Huge Wealth Redistribution Scheme
- When Can We Expect Lower FED Rates?
From Financial Trend Forecaster
- Moore Inflation Predictor
- NYSE ROC
- NASDAQ ROC
- The Dangerous Myth of a “Soft Landing”
- The Crux of China’s Problems
- Will a New BRICS Currency Dethrone the U.S. Dollar?
- The European Energy Crisis May Be Back Soon
- What Made Maui’s Lahaina Fire So Deadly?
- Which is Worse- Easy Money or Public Debt?
- Deepest Yield Curve Inversion Since 1981
- Is this the End of Fractional Reserve Banking?
- A Guide to Good Money
- Does Science Shape Economic Progress?
- Why Do Traders Really Lose Money?
- Quick Takes on Big Financial Trends
- Extremely Rare Market Signal Just Triggered
From OptioMoney.com
- DIY vs. Professional Movers
- 7 Ways to Increase the Value of Your Home
- Is a Home Warranty a Good Investment?
- What Happens to Old Solar Panels?
- The Art of DIY: Saving Money by Learning New Skills
- Smart Ways to Save Money on Everyday Expenses
- Simple Ways to Improve Your Relationship with Money
- How Buying a House Affects Your Finances
From Your Family Finances
- Transforming Your Money Mindset for a Brighter Future
- The Benefits of Downsizing
- What Causes Drafty Windows?
- The Advantages of Home Owner’s Insurance
- Low-Cost Ways to Keep Your House Cool
- Investment Rental Property Tips for a Competitive Market
- Unlocking 5 Secrets to Increasing Your Military Income
- How to Maximize Savings… Without Sacrificing Lifestyle
- Making Your Kido an Investment Genius