
Unemployment rates were lower in June in 6 states and stable in 44 states and the District of Columbia, the U.S. Bureau of Labor Statistics reported today. Three states had jobless rate decreases from a year earlier and 47 states and the District had little or no change.
Vermont had the lowest unemployment rate in June, 2.1 percent. The rates in Alabama (3.5 percent), Arkansas (3.5 percent), New Jersey (3.5 percent), and Texas (3.4 percent) set new series lows. (All state series begin in 1976.) Alaska and Puerto Rico had the highest jobless rates, at 6.4 and 8.4 percent respectively. In total, 13 states had unemployment rates lower than the U.S. figure of 3.7 percent, 9 states and the District of Columbia had higher rates, and 28 states had rates that were not appreciably different from that of the nation.
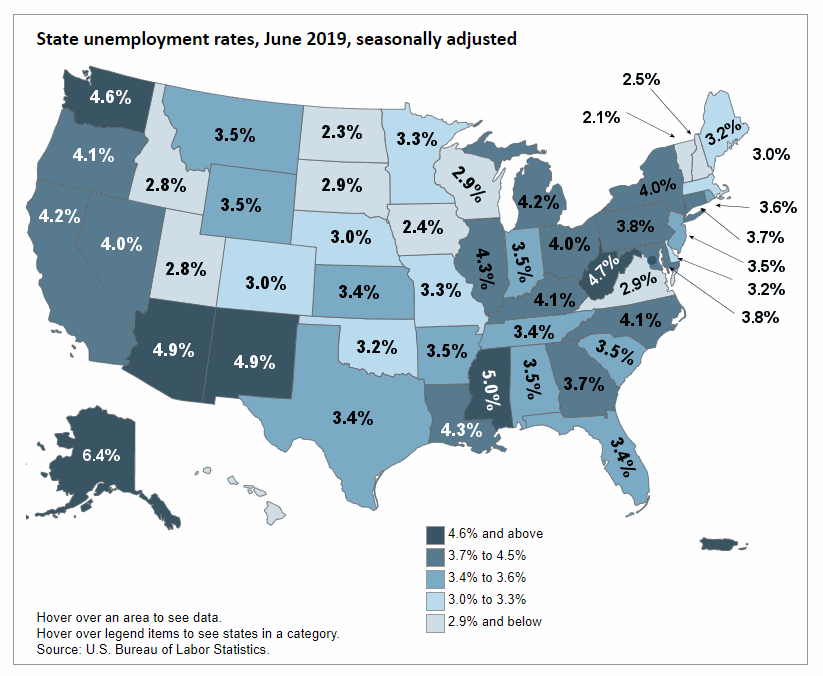
Table of U.S. State Political Party statistics as of January 2019
I’ve sorted the following table by political party. If we look at it this way, we can see that the average unemployment of the strictly Democrat states is 3.85%, the strictly Republican states are 3.52%, and the mixed states are 3.55%. When we looked at unemployment by state and political party back in July 2017 we found that Democrat states were at 4.4%, Republican states were at 3.8% and mixed states were at 4.2%. But this was based strictly on 2016 Presidential Election Results. In this table, we also take into account governor, state senate and state house political affiliation.
In that article, we also covered some of the terrible things going on in Alaska that makes it an exception to the rule.
Interestingly in this year’s data, we can see that both Arizona and New Mexico have higher than average unemployment rates at 4.9% and one is Democrat and the other Republican. So why is that? Could it be because of all of the illegal immigrants entering those states?
| State | 2016 Presidential Election | Governor | State Senate | State House | June 2019 Unemployment | Average |
|---|---|---|---|---|---|---|
| California | Democrat | Democrat | Democrat 29-11 | Democrat 61-19 | 4.2% | |
| Colorado | Democrat | Democrat | Democrat 19-16 | Democrat 41-24 | 4.5% | |
| Connecticut | Democrat | Democrat | Democrat 22-14 | Democrat 91-60 | 3.0% | |
| Delaware | Democrat | Democrat | Democrat 12-9 | Democrat 26-15 | 3.2% | |
| Hawaii | Democrat | Democrat | Democrat 24-1 | Democrat 46-5 | 2.8% | |
| Illinois | Democrat | Democrat | Democrat 40-19 | Democrat 74-44 | 4.3% | |
| Maine | Democrat | Democrat | Democrat 21-14 | Democrat 89-56-6 | 3.2% | 3.85% |
| Nevada | Democrat | Democrat | Democrat 13-8 | Democrat 29-13 | 4.0% | |
| New Jersey | Democrat | Democrat | Democrat 25-15 | Democrat 54-26 | 3.5% | |
| New Mexico | Democrat | Democrat | Democrat 26-16 | Democrat 46-24 | 4.9% | |
| New York | Democrat | Democrat | Democrat 40-22-1 | Democrat 106-43-12 | 4.0% | |
| Oregon | Democrat | Democrat | Democrat 18-12 | Democrat 38-22 | 4.1% | |
| Rhode Island | Democrat | Democrat | Democrat 33-5 | Democrat 66-9 | 3.6% | |
| Washington | Democrat | Democrat | Democrat 29-20 | Democrat 57-41 | 4.6% | |
| Alabama | Republican | Republican | Republican 27-8 | Republican 77-28 | 3.5% | |
| Arizona | Republican | Republican | Republican 17-13 | Republican 31-29 | 4.9% | |
| Arkansas | Republican | Republican | Republican 26-9 | Republican 76-24 | 3.5% | |
| Florida | Republican | Republican | Republican 23-17 | Republican 73-47 | 3.4% | |
| Georgia | Republican | Republican | Republican 35-21 | Republican 105-75 | 3.7% | |
| Idaho | Republican | Republican | Republican 28-7 | Republican 56-14 | 2.8% | |
| Indiana | Republican | Republican | Republican 40-10 | Republican 67-33 | 3.5% | |
| Iowa | Republican | Republican | Republican 32-18 | Republican 53-47 | 2.4% | |
| Kentucky | Republican | Republican | Republican 29-9 | Republican 61-39 | 4.1% | 3.52% |
| Mississippi | Republican | Republican | Republican 33-19 | Republican 74-46-2 | 5.0% | |
| Missouri | Republican | Republican | Republican 24-10 | Republican 116-47 | 3.3% | |
| North Dakota | Republican | Republican | Republican 37-10 | Republican 79-15 | 2.3% | |
| Ohio | Republican | Republican | Republican 24-9 | Republican 61-38 | 4.0% | |
| Oklahoma | Republican | Republican | Republican 39-9 | Republican 77-24 | 3.2% | |
| South Carolina | Republican | Republican | Republican 27-19 | Republican 80-44 | 3.5% | |
| South Dakota | Republican | Republican | Republican 30-5 | Republican 59-11 | 2.9% | |
| Tennessee | Republican | Republican | Republican 28-5 | Republican 73-26 | 3.4% | |
| Texas | Republican | Republican | Republican 19-12 | Republican 83-67 | 3.4% | |
| Utah | Republican | Republican | Republican 23-6 | Republican 59-16 | 2.8% | |
| West Virginia | Republican | Republican | Republican 20-14 | Republican 59-41 | 4.7% | |
| Wyoming | Republican | Republican | Republican 27-3 | Republican 50-9-1 | 3.5% | |
| Kansas | Republican | Democrat | Republican 28-11-12 | Republican 84-41 | 3.4% | |
| Louisiana | Republican | Democrat | Republican 25-14 | Republican 62-39-42 | 4.3% | |
| Michigan | Republican | Democrat | Republican 22-16 | Republican 58-52 | 4.2% | |
| Montana | Republican | Democrat | Republican 30-20 | Republican 58-42 | 3.5% | |
| North Carolina | Republican | Democrat | Republican 29-21 | Republican 65-55 | 4.1% | |
| Pennsylvania | Republican | Democrat | Republican 28-22 | Republican 110-93 | 3.8% | |
| Wisconsin | Republican | Democrat | Republican 19-14 | Republican 63-36 | 2.9% | 3.55% |
| Maryland | Democrat | Republican | Democrat 32-15 | Democrat 99-42 | 3.8% | |
| Massachusetts | Democrat | Republican | Democrat 34-6 | Democrat 127-32-1 | 3.0% | |
| New Hampshire | Democrat | Republican | Democrat 14-10 | Democrat 234-166 | 2.5% | |
| Vermont | Democrat | Republican | Democrat 22-6-22 | Democrat 95-43-122 | 2.1% | |
| Minnesota | Democrat | Democrat | Republican 35-32 | Democrat 75-59 | 3.3% | |
| Virginia | Democrat | Democrat | Republican 21-19 | Republican 51-49 | 2.9% | |
| Nebraska | Republican | Republican | Unicameral nonpartisan legislature | 3.0% | ||
| Alaska | Republican | Republican | Republican 13-7 | Coalition 25-15 | 6.4% | |