
The news is bristling with excitement as all the major media outlets are jumping on today’s employment numbers hot off the Bureau of Labor Statistics presses. The BLS reported that the Seasonally Adjusted U-3 unemployment rate was just 4.4% and the unadjusted broader based U-6 was just 8.1%.
In response to all this good news The New York Times said, “We’re Getting Awfully Close to Full Employment” and The Wall Street Journal trumpeted “Jobs Report: This Is What Full Employment Looks Like” so who am I to throw cold water on their parade? Well, at least I’m not the only one to have my doubts. Jared Bernstein at The Washington Post thinks that the current low inflation level is a factor that may indicate that we aren’t quite there yet. So I’m adding my own two-cents with the following chart. We regularly publish the U-6 minus U-3 chart which shows the differential between the ordinary unemployed U-3 and the bottom of the barrel unemployed U-6. By definition, in order to be at “full-employment” everyone who wants a job has to have one. That doesn’t mean Zero unemployment because there is a bit of friction in the system and so when people change jobs they are temporarily “unemployed” so there will always be some. Historically, this was assumed to be around 3% unemployment. So as the U-3 unemployment approaches 3% the U-6 people get drawn into the market. They may not have the skills or the ambition or the whatever but now they can find a job because companies are desperate.
So by looking at the U-6 minus the U-3 we can get a very good picture of when we are nearing “full employment”. So let’s look at that chart.
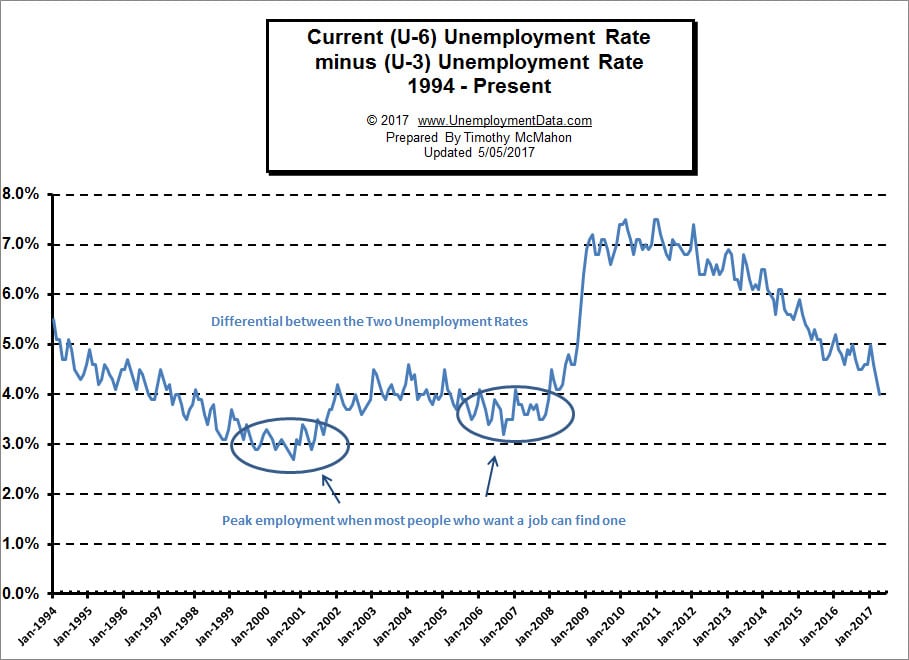
From the chart we can see that in the full employment period of the early 2000’s U-6 minus U-3 was in the 3% range. And in the 2006 -2008 period the U-6 minus U-3 was in the 3½% range. So with the current differential at 4%, we are just now approaching the “bad years” level of 2003-2005. The differential has to drop at least another half percent before we even get close to the “good years”. That could happen if U-6 drops a half percent and U-3 stays the same, but if they both drop a half percent the differential will remain the same. We did have a steep drop this month so we are on the right track but we still have a ways to go.
Labor Force Participation Rate
Another “fly in the ointment” is the Labor Force Participation Rate (LFPR) just because the current unemployment looks like it is low doesn’t mean that the actual situation is similar to that of 2000 or even 2006. Trying to use the current government numbers is like trying to use a rubber ruler. The measurements keep changing. And that is because of the LFPR. If we look at the chart we see:
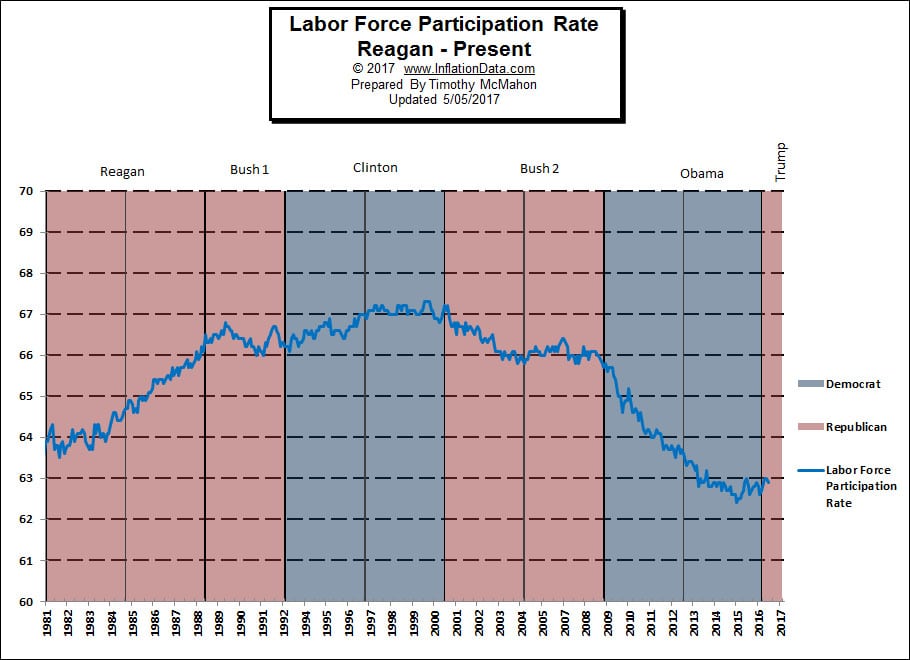
Since 2000, the Labor Force has gone from 67% of the population to 63% of the population. This means that an additional 4% of the population isn’t working but they aren’t counted in either U-3 unemployed or even in U-6. According to the U.S. Bureau of Labor Statistics once you leave the labor force you are no longer unemployed. So, if this 4% of the total population re-entered the workforce the unemployment rate would skyrocket by more than 4% (since the Labor Force is roughly 2/3rds of the population, 4% would result in something like a 6% bump in unemployment). So it all depends on why these people left the workforce. If they retired they probably aren’t coming back (but the data doesn’t support that conclusion). If they left because work prospects got really bad and they just gave up looking, they could be a massive supply overhang on the employment market.
Gallup Disagrees with the BLS
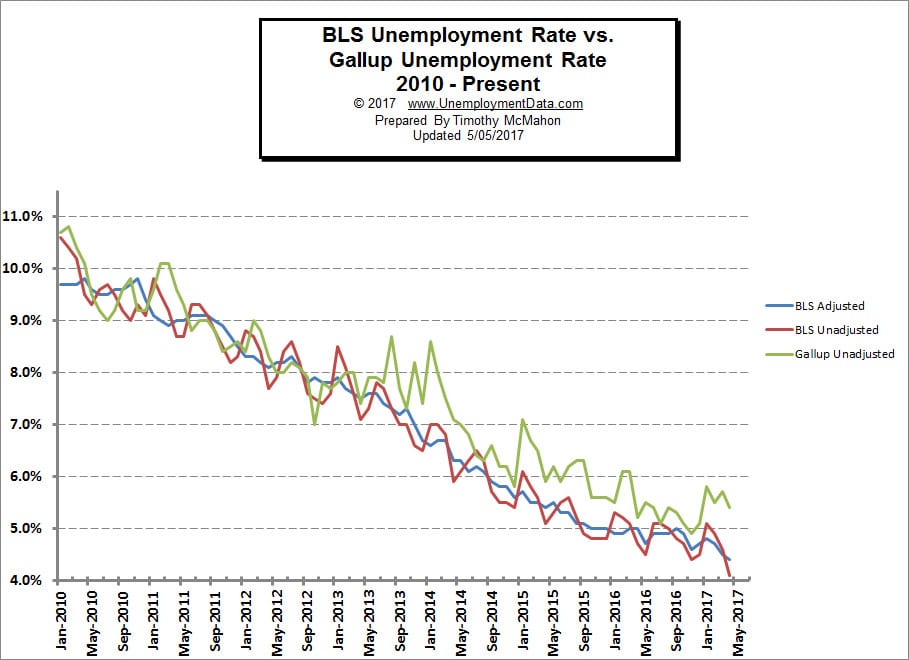
The final reason that we may not be entering full employment is because the numbers are just plain wrong. According to Gallup (the survey people) the real unadjusted U-3 is 5.4% not the 4.1% that the BLS says and the real U-6 is 14.0% not 8.1%. 5.4% unemployment is nowhere near full employment and 14% U-6 is still horrendous. Add to that another 4% due to LFPR and we’re still looking at 18% unemployment.
Some people have questioned the validity of the Gallup numbers, after all who are they to disagree with the almighty BLS?
For Calculating Unemployment the BLS tells us that it “interviews 60,000 different households statistically calculated to represent the entire country.” But if we read the “fine print” we find that they actually only contact about 15,000 of these households in any given month and then using statistical modeling they estimate the U.S. unemployment rate from this data sample. “The households in the pool are rotated to limit the burden on any specific family.”
Gallup on the other hand, creates weekly results which reflect “30-day rolling averages ending each Sunday, based on telephone interviews with approximately 30,000 adults.” So Gallup numbers are more current, have a larger sample size and lack a motivation for bias. In fact, since they sell their data, their motivation is to provide the most accurate data possible to their customers. So it is quite possible that Gallup’s numbers are right and the U.S. is a long way from “Full Employment”.