
See Current Unemployment Rate for latest information.
Gap Between BLS and Gallup Data Growing
The U.S. Bureau of Labor Statistics (BLS) released the data for January. According to the BLS, the current “Seasonally Adjusted” Unemployment Rate for January 2014 (released Februuary 7th) is 6.6% down from 6.7% in December. But the “Unadjusted” Unemployment Rate is 7% up from 6.5%. So the unadjusted rate went up by .5% and the adjusted rate went down by 0.1%.
However, according to surveys by the Gallup organization Adjusted Unemployment was actually 8.0% in January and Unadjusted Unemployment was 8.6%. Supposedly, the Gallup and BLS surveys are using the same methods! Last month the difference was 0.9% but this month it has grown to 1.4%!
| Adjusted | Unadjusted | |
| BLS | 6.6% | 7.0% |
| Gallup | 8.0% | 8.6% |
| Difference | 1.4% | 1.6% |
So we have a major divergence between what Gallup is telling us and what the BLS is claiming and the gap is significant. Last month the difference between the BLS unadjusted and Gallup unadjusted was 0.9% this month the difference is 1.6%. See Is the Government Fudging Unemployment Numbers? for the comparison of Gallup numbers vs. Bureau of Labor Statistics numbers.
In addition according to Gallup the U.S. Payroll to Population employment rate (P2P), as measured by Gallup, was only 42.9% in November (meaning that less than 43% of the people in the county are working) down from 44.6% in July and 45.7% in October 2012. And in January the P2P had fallen even further to only 42%. In other words according to Gallup, the percentage of the entire population of the country that is working is decreasing but according to the BLS unemployment is going down. Decreasing P2P should equal higher unemployment not lower, unless the people are dropping out of the workforce and not even looking for jobs.
Current US Unemployment Rate Chart
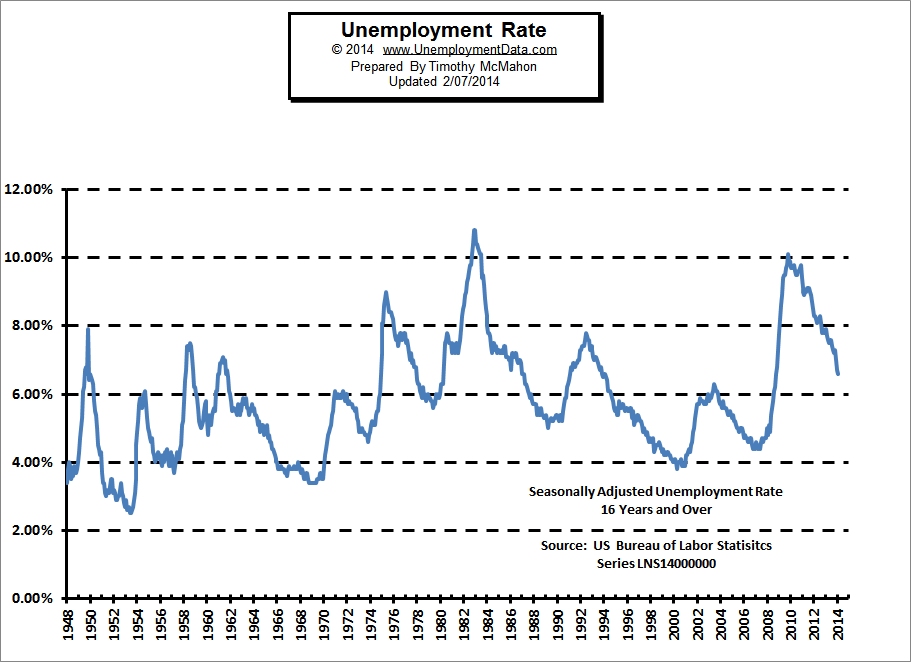
(Click for Larger Image)
If we compare the BLS unemployment numbers to their own employment numbers we can get an idea of what is really happening, unless they decide to have another major revision (read massive number fudging) like they did in December 2012.
In June 2013 the BLS said we had 136.769 million people employed (at least 1 hour a week) in November they say we had 137.942 million employed. So that looks good. A net increase of 1.173 million jobs. during that same period the civilian non-institutional population increased by 811,000.
To recap:
| Unadjusted U-6 | Unadjusted U-3 | Adjusted U-3 | Employment | Civilian Population | Net | |
| December 2011 | 15.2% | 8.3% | 8.5% | 133.292 Million | 240.584 Million | |
| December 2012 | 14.4% | 7.6% | 7.8% | 135.560 Million | 244.350 Million | |
| January 2013 | 15.4% | 8.5% | 7.9% | 132.704 Million | 244.663 Million | |
| February 2013 | 14.9% | 8.1% | 7.7% | 133.752 Million | 244.828 Million | |
| March 2013 | 13.9% | 7.6% | 7.6% | 134.570 Million | 244.995 Million | |
| April 2013 | 13.4% | 7.1% | 7.5% | 135.513 Million | 245.175 Million | |
| May 2013 | 13.4% | 7.3% | 7.6% | 136.383 Million | 245.363 Million | |
| June 2013 | 14.6% | 7.8% | 7.6% | 136.769 Million | 245.552 Million | |
| July 2013 | 14.3% | 7.7% | 7.4% | 135.577 Million | 245.756 Million | |
| August 2013 | 13.6% | 7.3% | 7.3% | 136.002 Million | 245.959 Million | |
| September 2013 | 13.1% | 7.0% | 7.2% | 136.612 Million | 246.168 Million | |
| October 2013 | 13.2% | 7.0% | 7.3% | 137.523 Million | 246.381 Million | |
| November 2013 | 12.7% | 6.6% | 7.0% | 137.999 Million | 246.567 Million | |
| December 2013 | 13.0% | 6.5% | 6.7% | 137.753 Million | 246.745 Million | |
| January 2014 | 13.5% | 7.0% | 6.6% | |||
| 2 mo. Change | -0.4% | -0.4% | -0.1% | 230,000 | 364,000 |
.230 -.364= -.134 |
| 12 mo. Change | -1.4% | -1.1% | -1.1% | 2.193 Million | 2.395 Million |
2.193-2.395= -0.202 |
So over the last 12 months employment has increased 2.193 million but the civilian non-institutional population (a fairly narrow measurement of population) increased by 2.395 Million so that results in a comparative net LOSS of 202,000. This agrees with to Gallup’s Payroll to Population (P2P) employment rate. So how can a decline in P2P possibly result in a decline in unemployment by -1.1% ? So even using the BLS’s own Employment numbers we can see that the Unemployment rate is not accurate.
Note: With all the scandals coming out of Washington these days, the key question of course is whether we can actually trust the numbers coming out of the BLS. I’ve been saying for a while that the unemployment numbers don’t match up with the employment numbers. In January 2013 the BLS decided to “fix” this problem. But rather than give us the real unemployment numbers they just went back to July of 1991 and simply changed the employment numbers. How the number of people employed could have suddenly changed that far back in history is beyond me, especially considering that they are supposed to come from reports from employers.
The change started small and grew to 738,000 jobs at the peak in December 2012. Yes, they simply added 3/4 million jobs out of thin air. This year they figured that it went so well last year they would go back and magically invent some more jobs… so in January 2014 another 513,000 appeared out of thin air. Supposedly after 3 months the final numbers are in and they can’t be changed but that doesn’t seem to stop them. Note that they say the “benchmarking” goes back as far as January 2009 but in actuality they changed the numbers all the way back to January 1978. Somehow by calling it “annual practice” that makes it OK.
Here is how the BLS explains it:
Revisions to Establishment Survey Data

In accordance with annual practice, the establishment survey data released today have been
benchmarked to reflect comprehensive counts of payroll jobs for March 2013. These counts
are derived principally from the Quarterly Census of Employment and Wages (QCEW), which
enumerates jobs covered by the UI tax system. The benchmark process results in revisions
to not seasonally adjusted data from April 2012 forward. Seasonally adjusted data from
January 2009 forward are subject to revision. In addition, data for some series prior to
2009, both seasonally adjusted and unadjusted, incorporate revisions.

The total nonfarm employment level for March 2013 was revised upward by 369,000 (+347,000
on a not seasonally adjusted basis, or 0.3 percent). The average benchmark revision over
the past 10 years was plus or minus 0.3 percent.

This revision incorporates the reclassification of jobs in the QCEW. Private household
employment is out of scope for the establishment survey. The QCEW reclassified some
private household employment into an industry that is in scope for the establishment
survey--services for the elderly and persons with disabilities. This reclassification
accounted for an increase of 466,000 jobs in the establishment survey. This increase of
466,000 associated with reclassification was offset by survey error of -119,000 for a
total net benchmark revision of +347,000 on a not seasonally adjusted basis. Historical
time series have been reconstructed to incorporate these revisions.

The effect of these revisions on the underlying trend in nonfarm payroll employment was
minor. For example, the over-the-year change in total nonfarm employment for 2013 was
revised from 2,186,000 to 2,322,000 seasonally adjusted. Table A presents revised total
nonfarm employment data on a seasonally adjusted basis for January through December 2013.

All revised historical CES data, as well as an article that discusses the benchmark and
post-benchmark revisions and other technical issues can be accessed through the CES
homepage at www.bls.gov/ces/. Information on the data released today also may be obtained
by calling (202) 691-6555.