
June’s Seasonally Adjusted Unemployment is Down slightly since May from 4.3% to 4.2%.
Updated July 2, 2026
![]()
- Seasonally Adjusted U-3 is 4.2% down from 4.3%
- Unadjusted U-3 is 4.4% up from 4.1%
- Unadjusted U-6 is 8.2% up from 7.7%
- Labor Force Participation is 61.5% down from 61.8%
- Unadjusted Employment rose from 159.398 million to 159.830 million
- Next Update: August 7th, 2026
Summary:
Despite the Adjusted U-3 being DOWN, this report is weaker than the headline unemployment rate suggests. Although the decline in unemployment looks encouraging at first glance, we can see that the Unadjusted numbers are actually up and Labor Force Participation is down, which tends to skew the appearance of the U-3. Another factor making the U-3 number look better is the BLS revising the previous employment numbers down, so this month’s gains look bigger.
The good news
- Companies are still reluctant to lay off workers.
- Wage growth remains reasonably healthy.
- Professional and business services, healthcare, and social assistance continued adding jobs.
According to the Commissioner of the U.S. Bureau of Labor Statistics:
“Both total nonfarm payroll employment (+57,000) and the unemployment rate (4.2 percent) changed little in June, the U.S. Bureau of Labor Statistics reported today. Employment continued to trend up in professional and business services, social assistance, and health care. Leisure and hospitality lost jobs…
The number of long-term unemployed (those jobless for 27 weeks or more) changed little at 1.9 million in June but is up by 286,000 over the year. The long-term unemployed accounted for 27.3 percent of all unemployed people in June.“
As usual, they are talking about “Seasonally Adjusted Jobs”.
Looking at the Unadjusted Establishment Survey report, we see…
Last month, the BLS reported employment of 158.726 million for April, which they have adjusted down to 158.713 million a decrease of 13,000. Original May numbers were 159.467 million, adjusted to 159.398 million, a decrease of 69,000 for a combined decrease of 82,000. But based on the revised numbers, employment is still up by 1.117 million since April.
Unemployment Levels Since 2005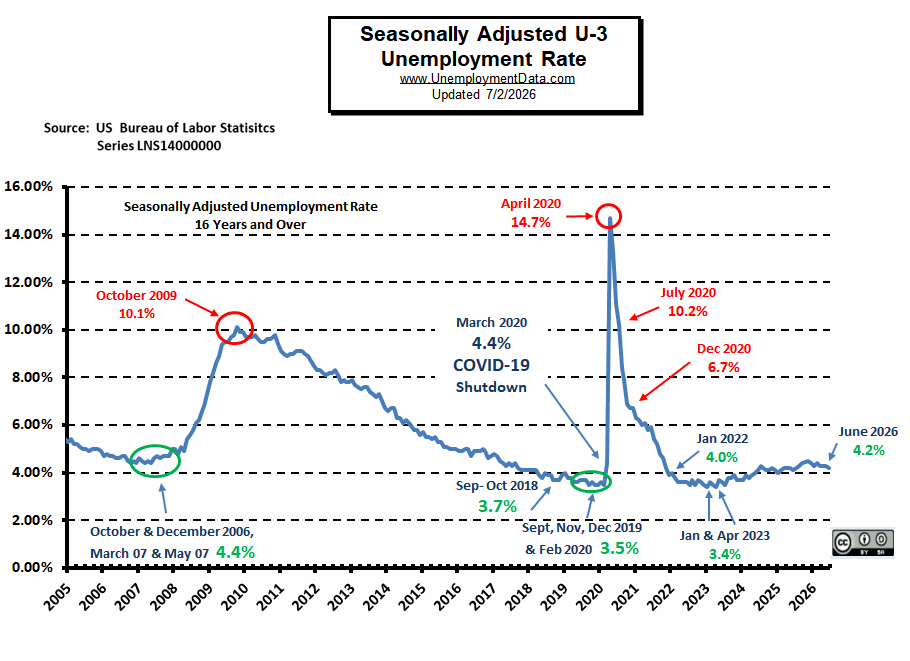
According to the BLS Commissioner’s report:
“Both total nonfarm payroll employment (+57,000) and the unemployment rate (4.2 percent) changed little in June, the U.S. Bureau of Labor Statistics reported today. Employment continued to trend up in professional and business services, social assistance, and health care. Leisure and hospitality lost jobs…
The number of long-term unemployed (those jobless for 27 weeks or more) changed little at 1.9 million in June but is up by 286,000 over the year. The long-term unemployed accounted for 27.3 percent of all unemployed people in June.“
You can read the full BLS report here.
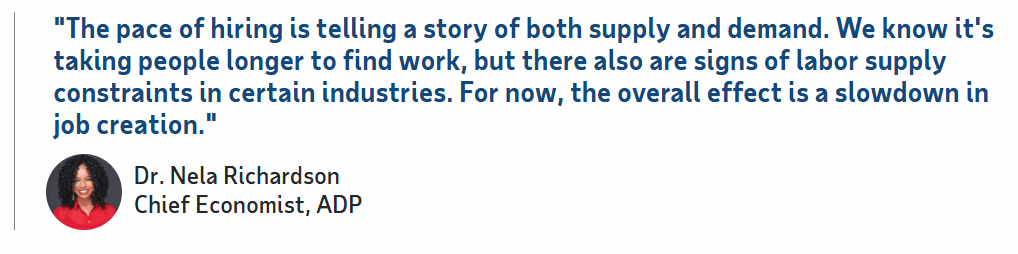
ADP® National Employment Report
ADP® provides an independent (non-government) estimate of private-sector employment and pay, based on data derived from ADP client payrolls. Their report is entirely different than the BLS version.
ADP: Private employers added 98,000 jobs in June
- Job creation was uneven in June. Financial activities and information were among the gainers, while leisure and hospitality delivered a sixth month of weak hiring.
BLS: UNadjusted and Seasonally Adjusted U3 Unemployment Rates
| Date | Unadjusted U3 | Adjusted U3 |
| June 2026 | 4.4% | 4.2% |
| May 2026 | 4.1% | 4.3% |
| April 2026 | 4.0% | 4.3% |
| March 2026 | 4.3% | 4.3% |
| February 2026 | 4.7% | 4.4% |
| January 2026 | 4.7% (was 4.6%) | 4.3% |
| December 2025 | 4.1% | 4.4% |
| November 2025 | 4.3% | 4.5% |
| October 2025 | NA* | NA* |
| September 2025 | 4.3% | 4.4% |
| August 2025 | 4.5% | 4.3% |
| July 2025 | 4.6% | 4.2% |
| June 2025 | 4.4% | 4.1% |
| May 2025 | 4.0% | 4.2% |
| April 2025 | 3.9% | 4.2% |
| March 2025 | 4.2% | 4.2% |
| February 2025 | 4.5% | 4.1% |
| January 2025 | 4.4% | 4.0% |
| December 2024 | 3.8% | 4.1% |
| November 2024 | 4.0% | 4.2% |
| October 2024 | 3.9% | 4.1% |
| September 2024 | 3.9% | 4.1% |
| August 2024 | 4.4% | 4.2% |
| July 2024 | 4.5% | 4.3% |
| June 2024 | 4.3% | 4.1% |
| May 2024 | 3.7% | 4.0% |
| April 2024 | 3.5% | 3.9% |
| March 2024 | 3.9% | 3.8% |
| February 2024 | 4.2% | 3.9% |
| January 2024 | 4.1% | 3.7% |
| December 2023 | 3.5% | 3.7% |
| November 2023 | 3.5% | 3.7% |
| October 2023 | 3.6% | 3.9% |
| September 2023 | 3.6% | 3.8% |
| August 2023 | 3.9% | 3.8% |
| July 2023 | 3.8% | 3.5% |
| June 2023 | 3.8% | 3.6% |
| May 2023 | 3.4% | 3.7% |
| April 2023 | 3.1% | 3.4% |
| March 2023 | 3.6% | 3.5% |
| February 2023 | 3.9% | 3.6% |
| January 2023 | 3.9% | 3.4% |
| December 2022 | 3.3% | 3.5% |
| November 2022 | 3.4% | 3.6% |
| October 2022 | 3.4% | 3.7% |
| September 2022 | 3.3% | 3.5% |
| August 2022 | 3.8% | 3.7% |
| July 2022 | 3.8% | 3.5% |
| June 2022 | 3.8% | 3.6% |
| May 2022 | 3.4% | 3.6% |
| April 2022 | 3.3% | 3.6% |
| March 2022 | 3.8% | 3.6% |
| February 2022 | 4.1% | 3.8% |
| January 2022 | 4.4% | 4.0% |
| December 2021 | 3.7% | 3.9% |
| November 2021 | 3.9% | 4.2% |
| October 2021 | 4.3% | 4.6% |
| September 2021 | 4.6% | 4.8% |
| August 2021 | 5.3% | 5.2% |
| July 2021 | 5.7% | 5.4% |
| June 2021 | 6.1% | 5.9% |
| May 2021 | 5.5% | 5.8% |
| April 2021 | 5.7% | 6.1% |
| March 2021 | 6.2% | 6.0% |
| February 2021 | 6.6% | 6.2% |
| January 2021 | 6.8% | 6.3% |
| December 2020 | 6.5% | 6.7% |
| November 2020 | 6.4% | 6.7% |
| October 2020 | 6.6% | 6.9% |
| September 2020 | 7.7% | 7.9% |
| August 2020 | 8.5% | 11.1% |
| July 2020 | 10.5% | 13.3% |
| June 2020 | 11.2% | 11.1% |
| May 2020 | 13.0% | 13.3% |
| April 2020 | 14.4% | 14.7% |
| March 2020 | 4.5% | 4.4% |
| February 2020 | 3.8% | 3.5% |
| January 2020 | 4.0% | 3.6% |
The worst months (highest unemployment) are usually January, June, and July. The best months (lowest unemployment) are typically November and March or April.
*October 2025 Data not Available due to Government Shutdown
Seasonally Adjusted Unemployment Rate Chart 1948-Present
US Unemployment Rate Chart since 1948
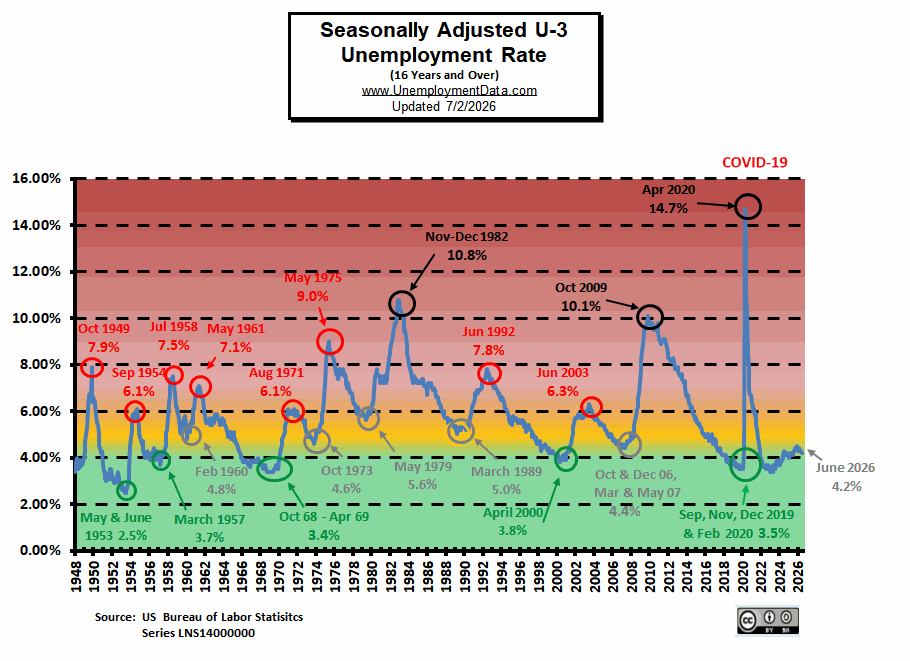
As we can see from the chart above, unemployment is about 0.7% above the pre-COVID lows of 2019 and the January and April lows of 2023.
Before the COVID-19 spike, February 2020’s 3.5% Seasonally Adjusted U-3 unemployment levels were excellent, i.e., just a hair above the 1969 lows of 3.4%. The only break below 3.4% was all the way back in 1953 (during the Korean War). The COVID-19 worldwide spike led to unprecedentedly high unemployment levels, but then returned to the “excellent” range. At 4.3% it is still in the “Good” range.
Previous Record Low Unemployment Rates (Seasonally Adjusted U-3)
If we consider anything 4% or below as “low,” we have had a few “low” stretches, as shown in the table below.
(4% or below in Green)
| Jan | Feb | Mar | Apr | May | Jun | Jul | Aug | Sep | Oct | Nov | Dec | |
| 1950 | 6.5% | 6.4% | 6.3% | 5.8% | 5.5% | 5.4% | 5.0% | 4.5% | 4.4% | 4.2% | 4.2% | 4.3% |
| 1951 | 3.7% | 3.4% | 3.4% | 3.1% | 3.0% | 3.2% | 3.1% | 3.1% | 3.3% | 3.5% | 3.5% | 3.1% |
| 1952 | 3.2% | 3.1% | 2.9% | 2.9% | 3.0% | 3.0% | 3.2% | 3.4% | 3.1% | 3.0% | 2.8% | 2.7% |
| 1953 | 2.9% | 2.6% | 2.6% | 2.7% | 2.5% | 2.5% | 2.6% | 2.7% | 2.9% | 3.1% | 3.5% | 4.5% |
| 1954 | 4.9% | 5.2% | 5.7% | 5.9% | 5.9% | 5.6% | 5.8% | 6.0% | 6.1% | 5.7% | 5.3% | 5.0% |
| 1955 | 4.9% | 4.7% | 4.6% | 4.7% | 4.3% | 4.2% | 4.0% | 4.2% | 4.1% | 4.3% | 4.2% | 4.2% |
| 1956 | 4.0% | 3.9% | 4.2% | 4.0% | 4.3% | 4.3% | 4.4% | 4.1% | 3.9% | 3.9% | 4.3% | 4.2% |
| 1957 | 4.2% | 3.9% | 3.7% | 3.9% | 4.1% | 4.3% | 4.2% | 4.1% | 4.4% | 4.5% | 5.1% | 5.2% |
| 1958 | 5.8% | 6.4% | 6.7% | 7.4% | 7.4% | 7.3% | 7.5% | 7.4% | 7.1% | 6.7% | 6.2% | 6.2% |
| … | … | … | … | … | … | … | … | … | … | … | … | … |
| 1965 | 4.9% | 5.1% | 4.7% | 4.8% | 4.6% | 4.6% | 4.4% | 4.4% | 4.3% | 4.2% | 4.1% | 4.0% |
| 1966 | 4.0% | 3.8% | 3.8% | 3.8% | 3.9% | 3.8% | 3.8% | 3.8% | 3.7% | 3.7% | 3.6% | 3.8% |
| 1967 | 3.9% | 3.8% | 3.8% | 3.8% | 3.8% | 3.9% | 3.8% | 3.8% | 3.8% | 4.0% | 3.9% | 3.8% |
| 1968 | 3.7% | 3.8% | 3.7% | 3.5% | 3.5% | 3.7% | 3.7% | 3.5% | 3.4% | 3.4% | 3.4% | 3.4% |
| 1969 | 3.4% | 3.4% | 3.4% | 3.4% | 3.4% | 3.5% | 3.5% | 3.5% | 3.7% | 3.7% | 3.5% | 3.5% |
| 1970 | 3.9% | 4.2% | 4.4% | 4.6% | 4.8% | 4.9% | 5.0% | 5.1% | 5.4% | 5.5% | 5.9% | 6.1% |
| … | … | … | … | … | … | … | … | … | … | … | … | … |
| 1999 | 4.3% | 4.4% | 4.2% | 4.3% | 4.2% | 4.3% | 4.3% | 4.2% | 4.2% | 4.1% | 4.1% | 4.0% |
| 2000 | 4.0% | 4.1% | 4.0% | 3.8% | 4.0% | 4.0% | 4.0% | 4.1% | 3.9% | 3.9% | 3.9% | 3.9% |
| 2001 | 4.2% | 4.2% | 4.3% | 4.4% | 4.3% | 4.5% | 4.6% | 4.9% | 5.0% | 5.3% | 5.5% | 5.7% |
| … | … | … | … | … | … | … | … | … | … | … | … | … |
| 2018 | 4.0% | 4.1% | 4.0% | 4.0% | 3.8% | 4.0% | 3.8% | 3.8% | 3.7% | 3.8% | 3.8% | 3.9% |
| 2019 | 4.0% | 3.8% | 3.8% | 3.6% | 3.7% | 3.7% | 3.7% | 3.7% | 3.5% | 3.6% | 3.6% | 3.6% |
| 2020 | 3.5% | 3.5% | 4.4% | 14.7% | 13.2% | 11.0% | 10.2% | 8.4% | 7.9% | 6.9% | 6.7% | 6.7% |
| 2021 | 6.3% | 6.2% | 6.1% | 6.1% | 5.8% | 5.9% | 5.4% | 5.2% | 4.8% | 4.5% | 4.2% | 3.9% |
| 2022 | 4.0% | 3.8% | 3.6% | 3.6% | 3.6% | 3.6% | 3.5% | 3.7% | 3.5% | 3.7% | 3.6% | 3.5% |
| 2023 | 3.4% | 3.6% | 3.5% | 3.4% | 3.7% | 3.6% | 3.5% | 3.8% | 3.8% | 3.9% | 3.7% | 3.7% |
| 2024 | 3.7% | 3.9% | 3.8% | 3.9% | 4.0% | 4.1% | 4.3% | 4.2% | 4.1% | 4.1% | 4.2% | 4.1% |
| 2025 | 4.0% | 4.1% | 4.2% | 4.2% | 4.2% | 4.1% | 4.2% | 4.3% | 4.4% | 4.45%** | 4.5% | 4.4% |
| 2026 | 4.3% | 4.4% | 4.3% | 4.3% | 4.3% | 4.2% |
**Actual October 2025 Data not Available due to Government Shutdown (number is Average of surrounding numbers)
The following video gives a good explanation of the definition of unemployment.
COVID and Unemployment
Due to the Virus, we can also see that the 2020 numbers started the year much better than the 2010 numbers (during the post-2008 recession), i.e., 3.6% vs. 9.7% in 2010. Then 2020 got worse quickly, i.e., 14.7% in 2020 vs. 9.8% in 2010, but 2020 improved quickly while 2010 did not. Adjusted U-3 ended 2010 at 9.4% and 2020 at 6.7%.
| 2009 | 2010 | 2020 | ||||
| Unadjusted U3 | Adjusted U3 | Unadjusted U3 | Adjusted U3 | Unadjusted U3 | Adjusted U3 | |
| Jan | 8.5% | 7.8% | 10.6% | 9.7% | 4.0% | 3.6% |
| Feb | 8.9% | 8.2% | 10.4% | 9.7% | 3.8% | 3.5% |
| Mar | 9.0% | 8.6% | 10.2% | 9.7% | 4.5%* | 4.4%* |
| Apr | 8.6% | 8.9% | 9.5% | 9.8% | 14.4%* | 14.7%* |
| May | 9.1% | 9.4% | 9.3% | 9.6% | 13.0%* | 13.3%* |
| June | 9.7% | 9.5% | 9.6% | 9.5% | 11.2%* | 11.1%* |
| July | 9.7% | 9.5% | 9.7% | 9.5% | 10.5%* | 10.2%* |
| Aug | 9.6% | 9.7% | 9.5% | 9.6% | 8.5%* | 8.4%* |
| Sep | 9.5% | 9.8% | 9.2% | 9.6% | 7.7% | 7.9% |
| Oct | 9.5% | 10.1% | 9.0% | 9.7% | 6.6% | 6.9% |
| Nov | 9.4% | 9.9% | 9.3% | 9.8% | 6.4% | 6.7% |
| Dec | 9.7% | 9.9% | 9.1% | 9.4% | 6.5% | 6.7% |
*COVID-19 Shutdown
Peak in Blue
See: The current Unemployment Rate Chart below.
Employment and Unemployment Numbers:
From the table below, we can see that employment and unemployment numbers are close to Pre-COVID numbers. Employment numbers are above February 2020 numbers, but since then, the Civilian Population has increased dramatically.
| Unadjusted U-6 |
Unadjusted U-3 |
Adjusted U-3 |
Employment (in Millions) |
Civilian Population (in Millions) |
Monthly Civilian Population Increase |
|
| January 2012 | 16.2% | 8.8% | 8.3% | 131.098 | 242.269 | 1,685,000*** |
| January 2013 | 15.4% | 7.5% | 7.9% | 133.064 | 244.663 | 211,000 |
| January 2014 | 13.5% | 7.0% | 6.6% | 135.471 | 246.915 | 170,000 |
| January 2015 | 12.0% | 6.1% | 5.7% | 138.493 | 249.723 | 696,000*** |
| January 2016 | 10.5% | 5.3% | 4.9% | 141.072 | 252.397 | 461,000 |
| January 2017 | 10.1% | 5.1% | 4.8% | 143.377 | 254.082 | -660,000** |
| January 2018 | 8.9% | 4.5% | 4.1% | 145.412 | 256.780 | 671,000*** |
| January 2019 | 8.8% | 4.4% | 4.0% | 147.879* | 258.239 | -649,000** |
| January 2020 | 7.7% | 4.0% | 3.6% | 150.055 | 259.502* | -679,000** |
| January 2021 | 12.0% | 6.8% | 6.3% | 140.974 | 260.851* | -379,000** |
| February 2021 | 11.6% | 6.6% | 6.2% | 142.129 | 260.918 | 67,000 |
| March 2021 | 10.9% | 6.2% | 6.0% | 143.308 | 261.003 | 85,000 |
| April 2021 | 9.9% | 5.7% | 6.1% | 144.402 | 261.103 | 100,000 |
| May 2021 | 9.7% | 5.5% | 5.8% | 145.392 | 261.210 | 105,000 |
| June 2021 | 10.1% | 6.1% | 5.9% | 146.626 | 261.338 | 128,000 |
| July 2021 | 9.6% | 5.7% | 5.4% | 146.619 | 261.469 | 131,000 |
| August 2021 | 8.9% | 5.3% | 5.2% | 147.159 | 261.611 | 142,000 |
| September 2021 | 8.1% | 4.6% | 4.8% | 147.917 | 261.766 | 155,000 |
| October 2021 | 7.7% | 4.3% | 4.6% | 149.605 | 261.908 | 142,000 |
| November 2021 | 7.4% | 3.9% | 4.2% | 150.543 | 262.029 | 121,000 |
| December 2021 | 7.2% | 3.7% | 3.9% | 150.740 | 262.136 | 107,000 |
| January 2022 | 7.9% | 4.4% | 4.0% | 147.932 | 263.202 | 1,066,000*** |
| February 2022 | 7.6% | 4.1% | 3.8% | 149.606 | 263.324 | 122,000 |
| March 2022 | 7.1% | 3.8% | 3.6% | 150.411 | 263.444 | 120,000 |
| April 2022 | 6.6% | 3.3% | 3.6% | 151.434 | 263.559 | 115,000 |
| May 2022 | 6.7% | 3.4% | 3.6% | 152.264 | 263.679 | 120,000 |
| June 2022 | 7.0% | 3.8% | 3.6% | 153.175 | 263.835 | 156,000 |
| July 2022 | 7.2% | 3.8% | 3.5% | 152.813 | 264.012 | 177,000 |
| August 2022 | 7.0% | 3.8% | 3.7% | 153.208 | 264.184 | 172,000 |
| September 2022 | 6.4% | 3.3% | 3.5% | 153.730 | 264.356 | 172,000 |
| October 2022 | 6.3% | 3.4% | 3.7% | 154.936 | 264.535 | 179,000 |
| November 2022 | 6.4% | 3.4% | 3.6% | 155.519 | 264.708 | 173,000 |
| December 2022 | 6.4% | 3.3% | 3.5% | 155.211 | 264.844 | 136,000 |
| January 2023 | 7.4% | 3.9% | 3.4% | 152.688 | 265.962 | 1,118,000*** |
| February 2023 | 7.3% | 3.9% | 3.6% | 153.817 | 266.112 | 150,000 |
| March 2023 | 6.8% | 3.6% | 3.5% | 154.253 | 266.272 | 160,000 |
| April 2023 | 6.1% | 3.1% | 3.4% | 155.201 | 266.443 | 171,000 |
| May 2023 | 6.4% | 3.4% | 3.7% | 156.132 | 266.618 | 175,000 |
| June 2023 | 7.2% | 3.8% | 3.6% | 156.842 | 266.801 | 183,000 |
| July 2023 | 7.1% | 3.8% | 3.5% | 155.981 | 267.002 | 201,000 |
| August 2023 | 7.2% | 3.9% | 3.8% | 156.355 | 267.213 | 211,000 |
| September 2023 | 6.7% | 3.6% | 3.8% | 156.845 | 267.428 | 215,000 |
| October 2023 | 6.8% | 3.6% | 3.9% | 157.878 | 267.642 | 214,000 |
| November 2023 | 6.7% | 3.5% | 3.7% | 158.347 | 267.822 | 180,000 |
| December 2023 | 7.0% | 3.5% | 3.7% | 158.269 | 267.991 | 169,000 |
| January 2024 | 8.0% | 4.1% | 3.7% | 155.432 | 267.540 | -451,000** |
| February 2024 | 7.8% | 4.2% | 3.9% | 156.551 | 267.711 | 173,000 |
| March 2024 | 7.4% | 3.9% | 3.8% | 157.210 | 267.884 | 171,000 |
| April 2024 | 6.9% | 3.5% | 3.9% | 158.001 | 268.066 | 182,000 |
| May 2024 | 7.1% | 3.7% | 4.0% | 158.842 | 268.248 | 182,000 |
| June 2024 | 7.7% | 4.3% | 4.1% | 159.341 | 268.438 | 190,000 |
| July 2024 | 8.2% | 4.5% | 4.3% | 158.399 | 268.644 | 206,000 |
| August 2024 | 8.0% | 4.4% | 4.2% | 158.717 | 268.856 | 212,000 |
| September 2024 | 7.3% | 3.9% | 4.1% | 159.184 | 269.080 | 224,000 |
| October 2024 | 7.3% | 3.9% | 4.1% | 160.030 | 269.289 | 209,000 |
| November 2024 | 7.4% | 4.0% | 4.2% | 159.882 | 269.463 | 174,000 |
| December 2024 | 7.4% | 3.8% | 4.1% | 159.943 | 269.638 | 175,000 |
| January 2025 | 8.2% | 4.4% | 4.0% | 157.092 | 272.685 | 3,027,000** |
| February 2025 | 8.4% | 4.5% | 4.1% | 157.944 | 272.847 | 162,000 |
| March 2025 | 7.9% | 4.2% | 4.2% | 158.402 | 273.023 | 176,000 |
| April 2025 | 7.3% | 3.9% | 4.2% | 159.227 | 273.197 | 174,000 |
| May 2025 | 7.4% | 4.0% | 4.2% | 159.930 | 273.385 | 188,000 |
| June 2025 | 8.1% | 4.4% | 4.1% | 160.256 | 273.585 | 200,000 |
| July 2025 | 8.3% | 4.6% | 4.2% | 159.219 | 273.785 | 200,000 |
| August 2025 | 8.2% | 4.5% | 4.3% | 159.415 | 274.001 | 216,000 |
| September 2025 | 7.7% | 4.3% | 4.4% | 159.732 | 274.226 | 225,000 |
| October 2025 | NA* | NA* | NA* | 160.397 | NA* | NA* |
| November 2025 | 8.4% | 4.3% | 4.5% | 159.571 | 274.633 | NA* |
| December 2025 | 8.2% | 4.1% | 4.4% | 159.358 | 274.816 | 183,000 |
| January 2026 | 8.8%* was 8.7% |
4.7%* was 4.6% |
4.3% | 156.728* was 156.714 |
274.676* was 274.982 |
-140,000** |
| February 2026 | 8.3% | 4.7% | 4.4% | 157.214 | 274.766 | 90,000 |
| March 2026 | 8.0% | 4.3% | 4.3% | 157.751 | 274.858 | 92,000 |
| April 2026 | 7.7% | 4.0% | 4.3% | 158.713 | 274.955 | 97,000 |
| May 2026 | 7.7% | 4.1% | 4.3% | 159.3.98 | 275.054 | 99,000 |
| June 2026 | 8.2% | 4.4% | 4.2% | 159.830 | 275.166 | 112,000 |
| Unadj. U-6 |
Unadj. U-3 |
Adjusted U-3 |
Employment (in Millions) |
Civilian Population |
Civ. Pop. Increase |
|
| 1 mo. Change | 0.5% | 0.3% | -0.1% | 0.926 | 112,000 | |
| 12 mo. Change | 0.1% | 0.0% | 0.1% | 0.531 | 1,581,000 | |
| Since Jan 2020 | 0.5% | 0.4% | 0.6% | 9.773 | 15,664,000 |
Note: Due to COVID restrictions, employment dropped rapidly in 2020, but then employment rebounded. Therefore, we compare current employment levels to those before the COVID-19 pandemic (February 2020).
* Data not Available due to Government Shutdown.
* Data adjusted due to “incorporating updated population controls.”
**Due to the BLS syncing its data with the census bureau, which happens once a year (in January), and can be a huge change, so that doesn’t really mean that all of the increase or decrease occurred during January.
Read more about how Employment and Unemployment numbers compare.
* Population control adjustments to the CPS adjusted by BLS. January 2017 is the first time since we have been tracking the Civilian Population that we have seen a decrease. January 2016 saw an increase of 461,000. The BLS says that they readjust their numbers every January to match the Census Bureau numbers.
**Note: January 2017, 2019, 2020 & 2021 all showed a decrease, not on an annual basis but on a monthly basis, as the numbers reported in December are adjusted to correspond to the Census Bureau data.
*** January 2022, January 2023, and January 2025 showed a massive 1 million+ adjustment increase in population.
The last time we saw a major deviation from the normal increase was in January 2012, when the population increased by 1.685 million, possibly because Obama legalized a bunch of illegal aliens at that time. Is it possible that the 2017 -2021 downward adjustments are the result of Trump’s stricter immigration policies?
Labor Force Participation Rate (LFPR)
The LFPR can have a major impact on the actual level of unemployment. In November 2025, it was up slightly to 62.5% by June 2026, it was down to 61.5%.
Tom Thomas, one of our readers, reminds us that if you want to compare U-3 numbers, you have to do it in light of the Labor Force Participation Rate (LFPR). He said, “since U-3 only measures those who are actively looking for a job, if the labor force declines (i.e., lots of people stop looking), the U-3 rate will appear better than it actually is. So, in order to compare two time periods, you have to adjust for the LFPR.”
The tricky part is deciding what the baseline LFPR should be. This is essentially what the Shadow Stats (see below) and BLS’s own U-6 measure are trying to get at, though each takes a slightly different approach.
See Labor Force Participation Rate for more information.
Data Collection Methods:
For Calculating Unemployment, the BLS says they interview “60,000 different households statistically calculated to represent the entire country.” However, they only contact about 15,000 of these households each month, and then use statistical modeling to estimate the U.S. unemployment rate from this data sample. “The households in the pool are rotated to limit the burden on any specific family.” In addition to questions about employment status, the CPS tracks work experience, annual earnings, school enrollment, and whether school-aged children are working, etc.
See Is the Government Fudging Unemployment Numbers? for the comparison of Gallup numbers vs. Bureau of Labor Statistics numbers.
Historical Context
According to Shadowstats, the government is really underestimating unemployment by even more than our numbers suggest, since “long-term discouraged workers were defined out of official existence in 1994.” The new U-6 numbers only include short-term discouraged workers. Once we understand that the Labor Force Participation Rate does not include “Long-Term Unemployed”, we can see that a big part of the decline in the BLS numbers is accounted for simply by redefining long-term unemployed individuals as out of the labor force, and so as if by magic the unemployment rate falls. But the ShadowStats number, which refuses to ignore these people, remains steady.

See U-6 Unemployment Rate for more information on the broader U-6 unemployment calculation that includes these “discouraged” unemployed and gives a truer picture of the total unemployment situation. Also, see the Misery index ( which includes Unemployment Rate+ Inflation Rate). The adjusted unemployment rate in January of 2009, when Obama was sworn in, was 7.8%. Subsequently, the rate reached a peak of 10.1%. The average unemployment rate during the Bush presidency was 5.3%, and during the Clinton presidency, it was 5.2%. In addition to looking at the unemployment rate, I prefer to look at the actual employment rate, which often shows a different picture, in that we can see how many people are actually employed and it is less easily manipulated since the number of people who have opted for retirement or just stopped looking for work is not a factor. See the Current Employment Data.
How the US Government Comes Up with the Current Unemployment Rate
According to the U.S. Bureau of Labor Statistics, they don’t actually track the unemployment numbers, but instead, they base the all-important “Unemployment Rate” on a survey. You would think they would collect the numbers from the 50 states, which would get them from their unemployment offices. But that is not how it is done. Unemployment rates are calculated based on a random survey called the Current Population Survey (CPS). No one can accuse the government of being efficient. So, rather than calling the main office of 50 state offices (or having the 50 state numbers automatically reported). Instead, the government calls up 60,000 households every month and then estimates the unemployment rate based on that sample. According to the BLS,
Every month, one-fourth of the households in the sample are changed, so that no household is interviewed more than 4 consecutive months. This practice avoids placing too heavy a burden on the households selected for the sample. After a household is interviewed for 4 consecutive months, it leaves the sample for 8 months, and then is again interviewed for the same 4 calendar months a year later, before leaving the sample for good. This procedure results in approximately 75 percent of the sample remaining the same from month to month and 50 percent from year to year.
For more information on how the BLS performs the survey, see BLS: How the Government Measures Unemployment. Unemployment data is interesting, but my question is always… yeah, but how many real people actually have jobs? In addition to calling 60,000 households, the government also performs a Current Employment Statistics (CES) survey, where it collects data from employers. The CES survey sample is larger, and so the employment data is considered more reliable than the unemployment data. For more information, see: Current Employment Data Historical Employment Data Chart The Misery index measures inflation plus unemployment and is a good measure of the discomfort of the country’s population. Current Employment vs. Unemployment Chart Are they just two sides of the same coin, or is there more? Sometimes the best thing to do during times of economic decline is to go back to school and wait out the decline while improving your skills at the same time. See The Difference a Degree Makes in Unemployment Levels for more information on how a degree might help.
Source: US-BLS Current Unemployment Rate Data
What’s up, I desire to subscribe for this website to take most up-to-date
updates, therefore where can i do it please help out.
You can sign up to be notified of new posts on the home page in the right hand column where it says “eTrends Daily Newsletter”. Hope this helps.
Do you mind if I quote a couple of your posts as long as I provide credit and sources back to your webpage?
My blog site is in the very same area off interest as yours and my visitors would really benefit from
a lot of the information you provide here. Please let me know if this alright with you.
Cheers!
Lucas,
Sure no problem all we ask is a link back to the original page.
Good article and way of telling about unemployment
rates which is my presentation subject in institution of higher education.
Tim, If you want to compare U-3 numbers you have to look at the Labor Force Participation Rate. Bush admin averaged 5.2% with an LFPR around 65%. Obama’s current U-3 number of 6.7% was achieved with a LFPR of 63%.
In order to compare Obama to Bush, or any other administration for that matter you have to adjust the current U-3, UP by the difference in the LFPR. So, Obama’s U-3 number is really 8.7% when you adjust for the current, dismal LFPR.
So you have the BLS “number”, the Gallup number and the U-3 number adjusted for the LFPR under which the U-3 was achieved. My feeling is the LFPR-adjusted U-3 number is the most accurate
Tom, Good point. We usually look at Gallup’s Payroll to Population rate (P2P) which is similar to the LFPR but is even smaller because it is compared to the entire population rather than just the Labor Force. Nationwide the P2P has been dropping and is currently around 44%. Down from 50% a few years ago. http://www.gallup.com/poll/167129/washington-leads-nation-payroll-population.aspx
What needs to be recognized is that QE has brought slow but steady economic growth, rise in stock market indices, turn round of many recession hit companies and industries, and even cut in fiscal deficit. Exports are rising, too, cutting down the capital account deficit. All these indicators vividly point out that employment must have increased. Comparisons with the historical past are odious because technological imrovements and changes have improved labour productivity. Hence, the U. S. optimum unemployment rate would necessarily be higher than what it was before the global financial crisis in 2007-09. It is now necessary for the U. S. to alter its concept and base of unemployment in the new technological environment
So now that unemployment has reached levels last seen in 2000 what does that indicate regarding your “increased productivity” arguments? Productivity increased in 2008 primarily because businesses downsized and forced the remaining workers to do not only their own jobs but also those of their former peers or risk losing their own jobs as well. It had very little to do with technological improvements.