
Unemployment by State- August 2021
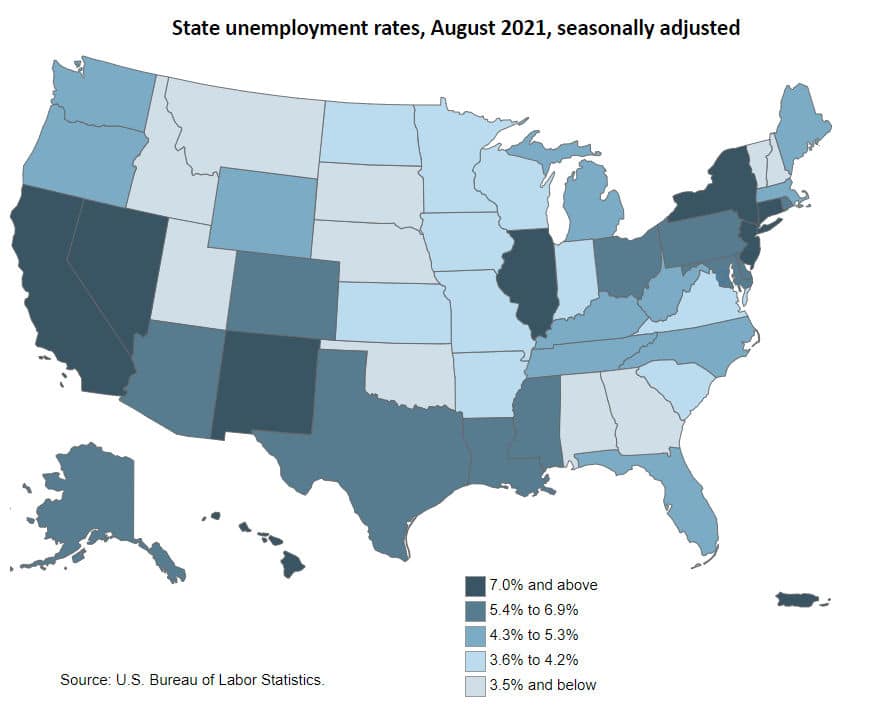
The U.S. Bureau of Labor Statistics releases the Unemployment rates for the country on the first Friday of the month. A couple of weeks later they release the breakdown for each of the fifty U.S. states. On September 17th 2021, they released the individual state unemployment numbers for August 2021.
According to the report, “Unemployment rates were lower in August in 15 states and the District of Columbia and stable in 35 states, the U.S. Bureau of Labor Statistics reported today. Forty-nine states and the District had jobless rate decreases from a year earlier and one state was little changed. The national unemployment rate, 5.2 percent, declined by 0.2 percentage point over the month and was 3.2 points lower than in August 2020. Nonfarm payroll employment increased in 11 states, decreased in 3 states, and was essentially unchanged in 36 states and the District of Columbia in August 2021. Over the year, 49 states and the District added nonfarm payroll jobs and 1 state was essentially unchanged.”
Seasonally Adjusted State Unemployment Levels
The following table provides the state unemployment levels alphabetically.
| State | Unemployment Rate August 2021 |
| Alabama | 3.1% |
| Alaska | 6.4% |
| Arizona | 6.2% |
| Arkansas | 4.2% |
| California | 7.5% |
| Colorado | 5.9% |
| Connecticut | 7.2% |
| Delaware | 5.4% |
| District of Columbia | 6.5% |
| Florida | 5.0% |
| Georgia | 3.5% |
| Hawaii | 7.0% |
| Idaho | 2.9% |
| Illinois | 7.0% |
| Indiana | 4.1% |
| Iowa | 4.1% |
| Kansas | 3.8% |
| Kentucky | 4.3% |
| Louisiana | 6.2% |
| Maine | 4.9% |
| Maryland | 5.9% |
| Massachusetts | 5.0% |
| Michigan | 4.7% |
| Minnesota | 3.8% |
| Mississippi | 6.0% |
| Missouri | 4.0% |
| Montana | 3.5% |
| Nebraska | 2.2% |
| Nevada | 7.7% |
| New Hampshire | 3.0% |
| New Jersey | 7.2% |
| New Mexico | 7.2% |
| New York | 7.4% |
| North Carolina | 4.3% |
| North Dakota | 3.6% |
| Ohio | 5.4% |
| Oklahoma | 3.2% |
| Oregon | 4.9% |
| Pennsylvania | 6.4% |
| Rhode Island | 5.8% |
| South Carolina | 4.2% |
| South Dakota | 2.9% |
| Tennessee | 4.6% |
| Texas | 5.9% |
| Utah | 2.6% |
| Vermont | 3.0% |
| Virginia | 4.0% |
| Washington | 5.1% |
| West Virginia | 4.8% |
| Wisconsin | 3.9% |
| Wyoming | 4.9% |
| Puerto Rico | 8.4% |
A few years ago, I was struck by the similarity between the unemployment map and this map…
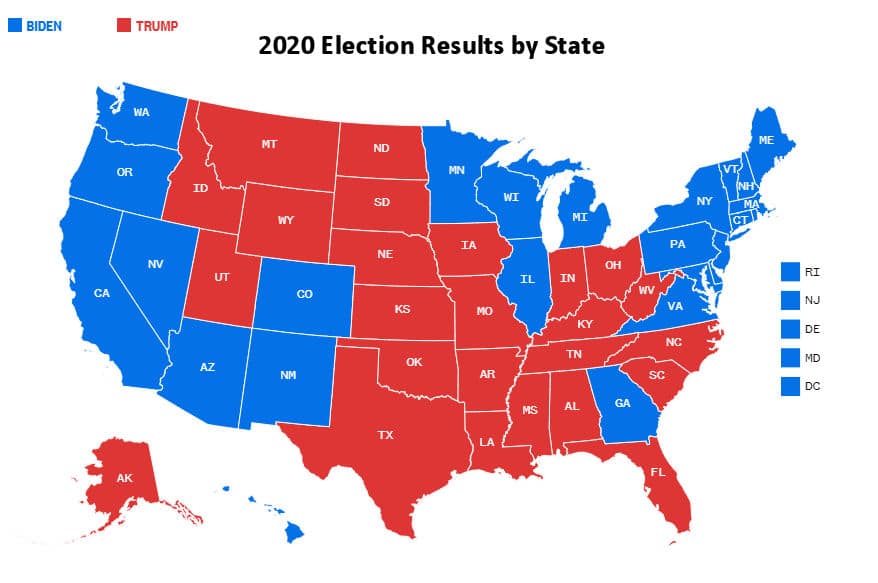 Yes, the election results map. (Although at the time it was based on the previous election). So I thought it would be interesting to look at the correlation between unemployment rates and political affiliation.
States Sorted by Unemployment Level
The following table is sorted by State’s unemployment rates, with the highest rates at the top. The table is also color-coded based on the political party that prevailed in the 2020 Presidential Election. In previous studies, we’ve found a bit higher correlation between the party of the State Governor and the State Legislature than the Presidential election but for the most part the political parties are roughly the same for State and Federal elections. So today we will just look at the presidential election results compared to the unemployment rate.
The following table is sorted by unemployment rate with the highest uneployment rates at the top. The first thing we notice is that out of the top 13 states only 1 voted Republican. If we scroll to the bottom of the table we see that out of the bottom 13 states only 4 voted Democrat.
If we look at averages we find that the Blue states have an average unemployment rate of 5.6% and the Red states have an average unemployment rate of 4.2%. This is a statistically significant difference of 1.4% which is exactly 1/3rd of 4.2%. So Blue state unemployment is 33.33% higher than Red States.
| State | Unemployment Rate August 2021 |
| Nevada | 7.7% |
| California | 7.5% |
| New York | 7.4% |
| Connecticut | 7.2% |
| New Jersey | 7.2% |
| New Mexico | 7.2% |
| Hawaii | 7.0% |
| Illinois | 7.0% |
| District of Columbia | 6.5% |
| Alaska | 6.4% |
| Pennsylvania | 6.4% |
| Arizona | 6.2% |
| Louisiana | 6.2% |
| Mississippi | 6.0% |
| Colorado | 5.9% |
| Maryland | 5.9% |
| Texas | 5.9% |
| Rhode Island | 5.8% |
| Delaware | 5.4% |
| Ohio | 5.4% |
| Washington | 5.1% |
| Florida | 5.0% |
| Massachusetts | 5.0% |
| Maine | 4.9% |
| Oregon | 4.9% |
| Wyoming | 4.9% |
| West Virginia | 4.8% |
| Michigan | 4.7% |
| Tennessee | 4.6% |
| Kentucky | 4.3% |
| North Carolina | 4.3% |
| Arkansas | 4.2% |
| South Carolina | 4.2% |
| Indiana | 4.1% |
| Iowa | 4.1% |
| Missouri | 4.0% |
| Virginia | 4.0% |
| Wisconsin | 3.9% |
| Kansas | 3.8% |
| Minnesota | 3.8% |
| North Dakota | 3.6% |
| Georgia | 3.5% |
| Montana | 3.5% |
| Oklahoma | 3.2% |
| Alabama | 3.1% |
| New Hampshire | 3.0% |
| Vermont | 3.0% |
| Idaho | 2.9% |
| South Dakota | 2.9% |
| Utah | 2.6% |
| Nebraska | 2.2% |
You might also like: