On Friday, December 2nd the U.S. Bureau of Labor Statistics (BLS) released their Employment and Unemployment data for the month of November. According to the BLS numbers Seasonally Adjusted U-3 unemployment was 4.6% down from 4.9% in October. Unadjusted U-3 was 4.4% down from 4.7%. According to Gallup unadjusted U-3 was 4.9% down from 5.1%.
U-6 unemployment was 9.0% according to the BLS down from 9.2% in October while Gallup’s equivalent “Underemployment Rate” was at 13%.
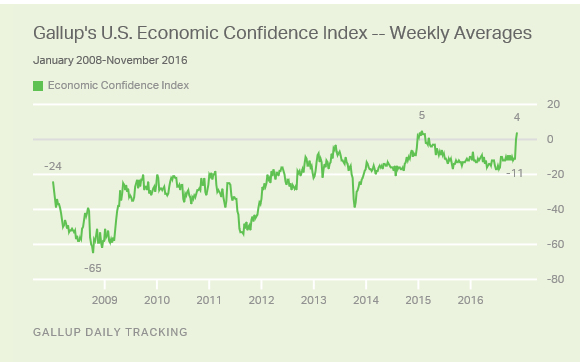
Interestingly, Gallup’s “Economic Confidence” jumped into positive territory shortly after the election for the first time since early 2015 and for only the second time since the index was created in early 2009. The week prior to the election economic confidence was at -11 and currently it is at +4. According to Gallup, “This is the first positive weekly reading in more than a year and a half.” Read the full story.
In other political news, President-Elect Trump has already set the tone for his Presidency by convincing Carrier to not outsource 1000 of the planned 2000 jobs slated to go to Mexico.
Current Unemployment Rate Chart-
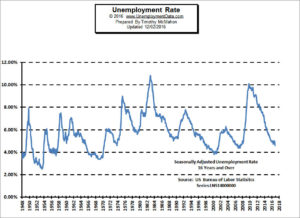
According to the BLS Commissioner’s report for this month:
“The unemployment rate declined by 0.3 percentage point to 4.6 percent in November, and nonfarm payroll employment increased by 178,000. Job growth continued in professional and business services and in health care. Thus far this year, nonfarm job growth has averaged 180,000 per month, compared with an average gain of 229,000 per month in 2015.”
See Current Unemployment Rate Chart for more info.
Current Employment Data
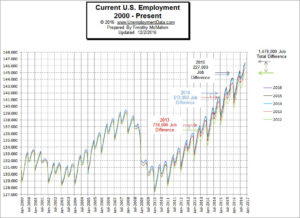
The number of Unadjusted jobs reported for November was 146.399 million up from June’s previous peak of 145.215 million and above November 2015’s prior peak of 144.122 million.
See Current Employment Data for more info.
Labor Force Participation Rate
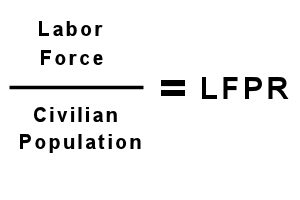
The Labor Force Participation Rate (LFPR) is the percentage of the population that is in the Labor Force i.e. Labor Force divided by Civilian Population equals the Labor Force Participation Rate.
So if the Labor Force shrinks because people quit looking for a job the LFPR falls. And because of the way that the unemployment rate is calculated:
- As the LFPR falls it appears that the unemployment rate is falling
- Even though there are the same number of people who can’t find jobs (but are no longer “officially” unemployed since they stopped looking for a job).
See Labor Force Participation Rate for more information.
Investing In Real Estate
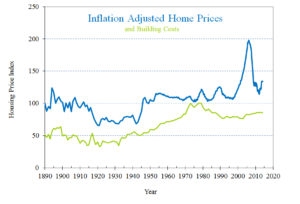
In this chart of Inflation-adjusted housing prices, we can see that for the majority of the time from 1890 through the present housing prices hovered around the 100 percent mark. However, there are a couple of notable exceptions… until the late 1990’s when low interest rates, combined with crazy government incentives drove the price of houses steadily upward. So an entire generation of buyers only saw housing prices climb.
See 6 Reasons Investing In Real Estate Can Be a Good Idea for more.
Employment vs Unemployment Chart
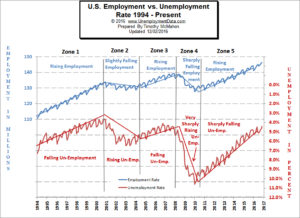
In the chart to the left, we see the longer term view and we can see that in zone 5 the official unemployment rate stopped tracking the employment rate and decreased much more sharply than the employment rate justifies. This is primarily due to a falling labor force participation rate.
See Employment vs. Unemployment for more.
Historical Employment Data
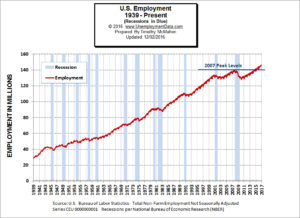
See Historical Employment Data for more.
See Also:
- Unemployment Rate Tables
- What is U-6 Unemployment?
- Unadjusted vs. Seasonally Adjusted Employment
- BLS vs. Gallup Unemployment Numbers
- Current U-6 Unemployment Rate
- Misery Index
You might also like:
- 10 Careers Off the Beaten Path
- Investing in Gold
- Inflation Up Almost 38% in September
- Trump Rally: False Dawn Or New Bullish Trend?
- Trump Changes Everything
- Retirees Working for Good
- What is a CD Ladder?
- Tips for Trading Options with Elliott Waves
- 7 Tips to Save Money While in the Military
- 4 Tips For Creating A Solid Family Financial Plan
- Be Sure Your Family is Secure Physically and Financially
- Home Maintenance: How To Save Money This Winter
- How to Take Charge of Your Money
- 5 Easy Ways to Pick Up Some Quick Cash

