
The U.S.Bureau of Labor Statistics (BLS) released the August unemployment numbers today. The BLS Commissioner says: “Nonfarm payroll employment increased by 156,000 in August, and the unemployment rate was little changed at 4.4 percent. Job gains occurred in manufacturing, construction, professional and technical services, health care, and mining. Employment growth has averaged 176,000 per month thus far this year, about in line with the average monthly gain of 187,000 in 2016.”
Actual employment in July was 146,330,000 and 146,541,000 in August for a net gain of 211,000 even though according to the Commissioner it was 156,000 on a “Seasonally Adjusted” basis.
- Adjusted U-3 Unemployment was 4.4% up from 4.3% in July.
- Unadjusted U-3 Unemployment was 4.5% down from 4.6% in July.
- Employment Increase 156,000 on a “Seasonally Adjusted” or 211,000 non-adjusted.
- U-6 Unemployment was 8.6% down from 8.9% in July.
August Employment Gain and Loss Bubbles
In the following chart from the BLS we can see the biggest gainer is the pink Education and Health Services bubble with 25,000 new jobs over the month of August. Average weekly earnings are slightly below average at $869.22 up slightly from $861.65. Another big gainer was the light green bubble representing Professional and Business Services with 40,000 new jobs and an above average weekly salary of $1,141.92 up from $1,133.64 in May. Leisure and hospitality (red bubble) also gained 4,000 jobs in August but average weekly earnings are only $402.22 up from $401.18 in May. Other gainers were manufacturing with a gain of 36,000 jobs at an average weekly earning of $1079.77.
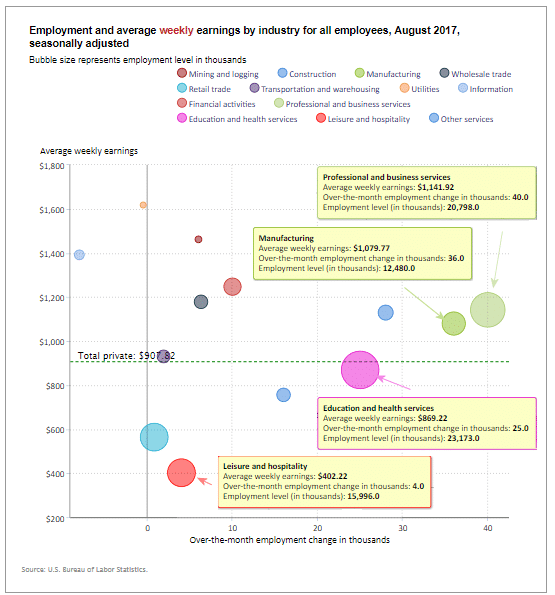
How to read this chart:
Bubbles location on the chart tell us two things:
- Change in Employment Levels over the most recent month.
- Average Weekly earnings.
The further to the right the bubble the larger the increase in the number of jobs. The higher up on the chart the larger the average salary.
The dotted horizontal line tells us the average weekly salary of all categories.
The solid vertical “Zero” line tells us that bubbles to the left of this line actually lost jobs this month.
Employment and Average Weekly Earnings by Industry for All Employees,
August 2017, Seasonally Adjusted
| Industry | Over-the-month-change in employment (in thousands) | Average weekly earnings | Employment level (in thousands) |
| Total private | 165 | $907.82 | 124,432 |
| Mining and logging | 6 | $1,461.94 | 719 |
| Construction | 28 | $1,129.44 | 6,918 |
| Manufacturing | 36 | $1,079.77 | 12,480 |
| Wholesale trade | 6.3 | $1,178.47 | 5,932 |
| Retail trade | 0.8 | $563.93 | 15,828 |
| Transportation and warehousing | 1.9 | $930.42 | 5,076 |
| Utilities | -0.5 | $1,617.96 | 552 |
| Information | -8 | $1,391.74 | 2,711 |
| Financial activities | 10 | $1,247.25 | 8,464 |
| Professional and business services | 40 | $1,141.92 | 20,798 |
| Education and health services | 25 | $869.22 | 23,173 |
| Leisure and hospitality | 4 | $402.22 | 15,996 |
| Other services | 16 | $755.89 | 5,783 |
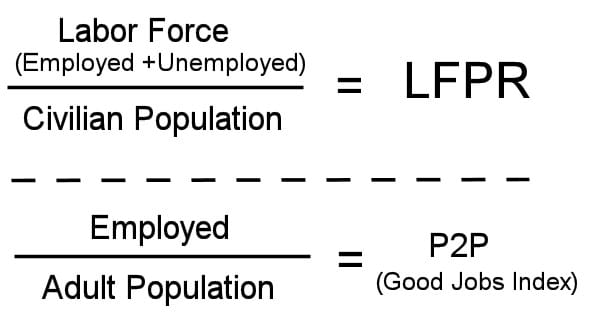
Labor Force Participation Rate (LFPR)
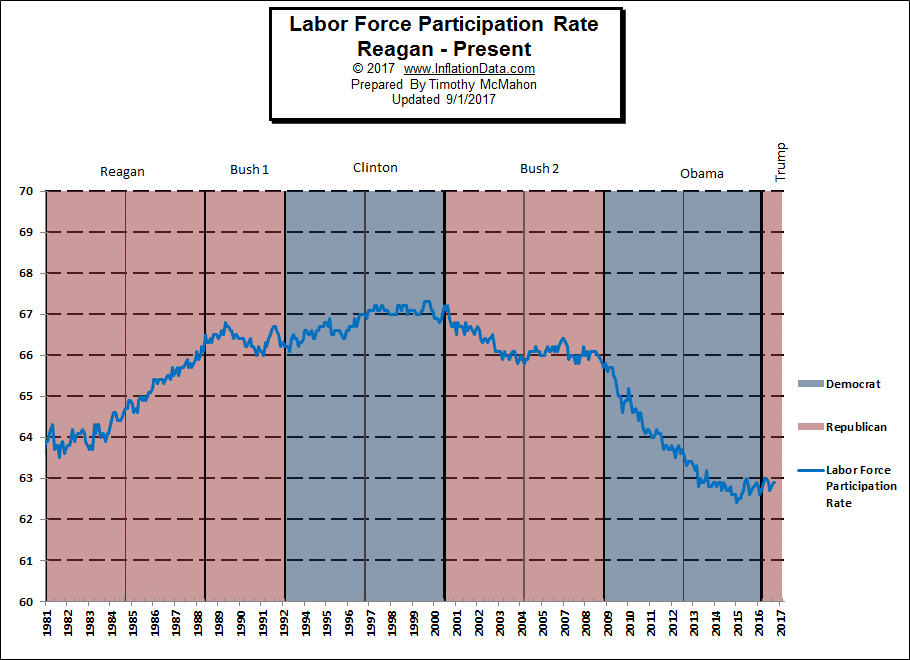 As the LFPR falls (bad) it appears that the unemployment rate is falling (good). So even though the ranks of the unemployed stays the same (or even grows) the numbers look like things are getting better. Conversely, as the LFPR rose under Reagan the unemployment could remain the same or even rise even though more people were actually working.
Read more about the Labor Force Participation Rate here.
Seasonally Adjusted Unemployment Rate Chart 1948-Present
The current “Unadjusted” rate is 4.4% which appears to be very low (equivalent to 2007) until you factor in the fact that the Labor force has declined drastically (see declining LFPR chart above). The population has increased by 22 million and the number of jobs has increased by only 7.3 million.
See: Current Unemployment Rate Chart here.
See Also: