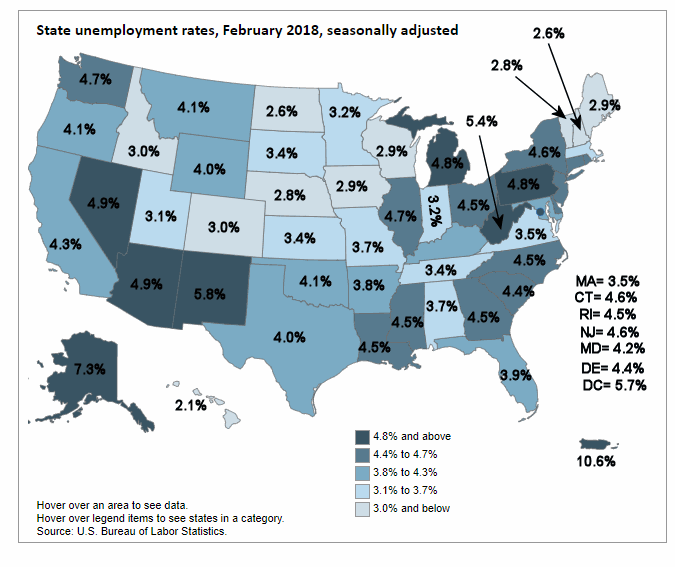
According to the U.S. Bureau of Labor Statistics’ most recent unemployment data broken down by state (released in March for the month of February), Hawaii had the lowest unemployment at 2.1% followed by North Dakota and New Hampshire at 2.6%. Vermont and Nebraska were also at 2.8%.
The rates in California (4.3%), Maine (2.9%), Mississippi (4.5%), and Wisconsin (2.9%) set new series lows. (All state series begin in 1976.)
Although not technically a state, Puerto Rico had the highest jobless rate at 10.6% followed by Alaska at 7.3% while New Mexico had 5.8%, the District of Columbia had 5.7% and West Virginia had 5.4%.
The following table lists the “Seasonally Adjusted” unemployment rate for each state in order from lowest unemployment to highest with Hawaii at the top and Alaska at the bottom.
Unemployment Rates for States, Seasonally Adjusted |
|
| State | February 2018 Rate |
| Hawaii | 2.1% |
| North Dakota | 2.6% |
| New Hampshire | 2.6% |
| Nebraska | 2.8% |
| Vermont | 2.8% |
| Iowa | 2.9% |
| Wisconsin | 2.9% |
| Idaho | 3.0% |
| Maine | 2.9% |
| Colorado | 3.0% |
| Utah | 3.1% |
| Minnesota | 3.2% |
| Indiana | 3.2% |
| Tennessee | 3.4% |
| Kansas | 3.4% |
| South Dakota | 3.4% |
| Massachusetts | 3.5% |
| Virginia | 3.5% |
| Missouri | 3.7% |
| Alabama | 3.7% |
| Arkansas | 3.8% |
| Florida | 3.9% |
| Texas | 4.0% |
| Wyoming | 4.0% |
| Montana | 4.1% |
| Oklahoma | 4.1% |
| Oregon | 4.1% |
| Kentucky | 4.1% |
| Maryland | 4.2% |
| California | 4.3% |
| Delaware | 4.4% |
| South Carolina | 4.4% |
| Mississippi | 4.5% |
| Louisiana | 4.5% |
| Georgia | 4.5% |
| North Carolina | 4.5% |
| Rhode Island | 4.5% |
| Ohio | 4.5% |
| Connecticut | 4.6% |
| New York | 4.6% |
| New Jersey | 4.6% |
| Washington | 4.7% |
| Illinois | 4.7% |
| Michigan | 4.8% |
| Pennsylvania | 4.8% |
| Arizona | 4.9% |
| Nevada | 4.9% |
| West Virginia | 5.4% |
| District of Columbia | 5.7% |
| New Mexico | 5.8% |
| Alaska | 7.3% |
| Puerto Rico | 10.6% |
| All States Average | 4.1% |

