The Bureau of Labor Statistics reported that: “Unemployment rates were higher in October in 26 states and stable in 24 states and the District of Columbia, the U.S. Bureau of Labor Statistics reported today. Twenty-one states had jobless rate decreases from a year earlier, 12 states and the District had increases, and 17 states had little change. The national unemployment rate, 3.9 percent, changed little both over the month and over the year.”
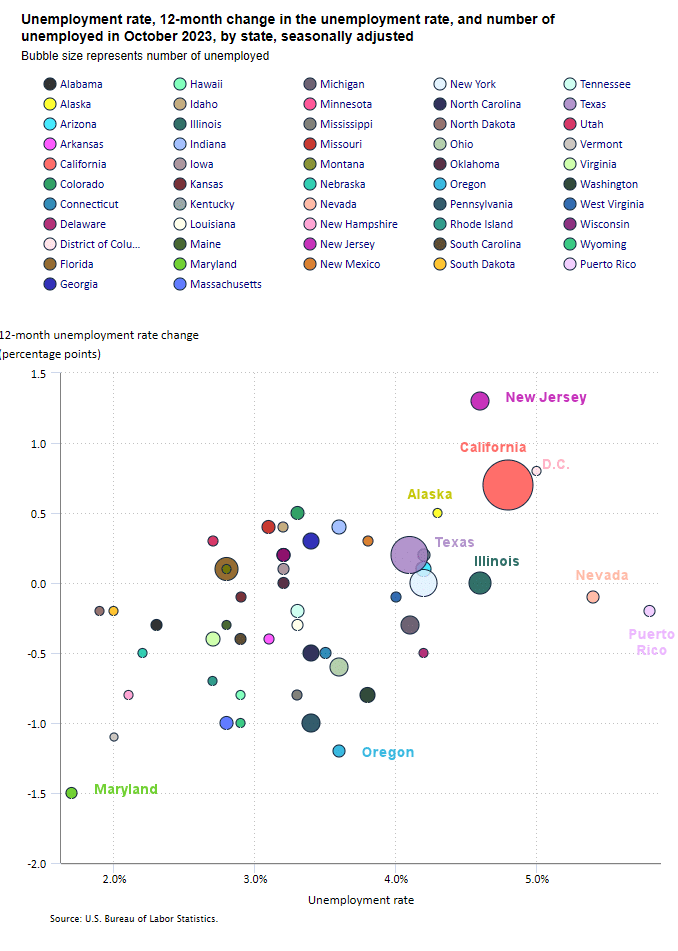
In the following chart, bubble size indicates the number of unemployed. As we can see the largest number of unemployed is the red California bubble followed by the purple Texas bubble.
The vertical axis indicates the percent change from a year ago. So, New Jersey has the biggest change from a year ago, followed by California and D.C. while the majority of states are below the zero line (indicating lower unemployment than a year ago). Maryland is the most improved followed by Oregon.
The horizontal axis indicates the current unemployment rate (in percent). Puerto Rico has the highest unemployment rate by far, followed by Nevada, D.C., California, New Jersey, and Illinois.
Source: BLS

