
 The U.S. Bureau of Labor Statistics (BLS) released the newest unemployment data for June 2015 on the first Thursday of July (rather than Friday due to the holiday). According to the BLS, the current “Seasonally Adjusted” Unemployment Rate for June is 5.3% down from May’s 5.5%. The BLS reported the “Unadjusted” Unemployment Rate is 5.5% which is lower than January’s 6.1% equal to last October’s unadjusted 5.5% but up from April’s 5.1%. See Current Unemployment Chart and Job Growth Stalls, Labor Participation at 38-Year Low for more information.
 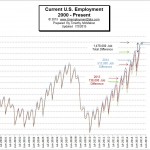 The BLS issued their “preliminary estimates” for the employment situation for the month of June 2015. The report states 142.589 million jobs reported. That’s up 455,000 from May. But at the same time they revised the numbers for May down by 58,000 making the real gain (compared to the numbers they reported last month) 397,000. See Current Employment Commentary for more information.
Historical Employment Levels Compared to Recessions
I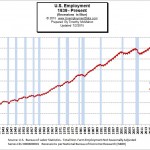 n addition to the number of jobs from 1939 through the present this chart shows the recessions shaded blue as per the official description of a “recession” by the National Bureau of Economic Research (NBER). Although during some periods which are classified as official recessions the unemployment rate didn’t skyrocket generally, recessions correspond pretty well to declines in employment (i.e. increased Unemployment). This is especially true since unemployment is one of the factors NBER uses to determine whether there is an official recession. But theoretically if all the other factors line up employment could remain steady and the economy could be in a recession. See Employment During Recessions for more information.
 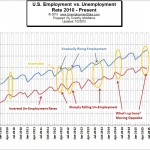 In this chart we compare employment vs. unemployment in an effort to get a more complete picture of the employment situation. Normally, you would think that they should simply be the inverse of each other. Flip one over and you have the other. But the U.S. Bureau of Labor Statistics (BLS) actually uses two entirely different surveys to calculate them. And the current chart shows [Read more…] about June Unemployment Data