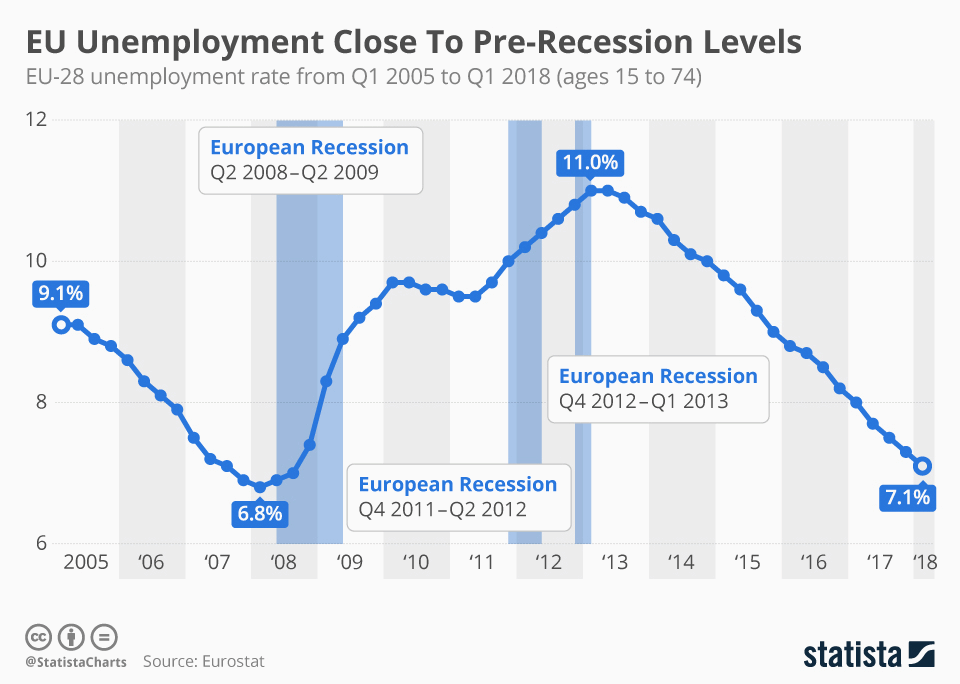
Way back in the first quarter of 2008 European Union (E.U.) unemployment bottomed at 6.8%. Then as the world slid into recession unemployment began climbing, ultimately peaking at 11.0% in the first half of 2013. From there it has gradually declined to 7.1% as we can see in this chart created by Statista.
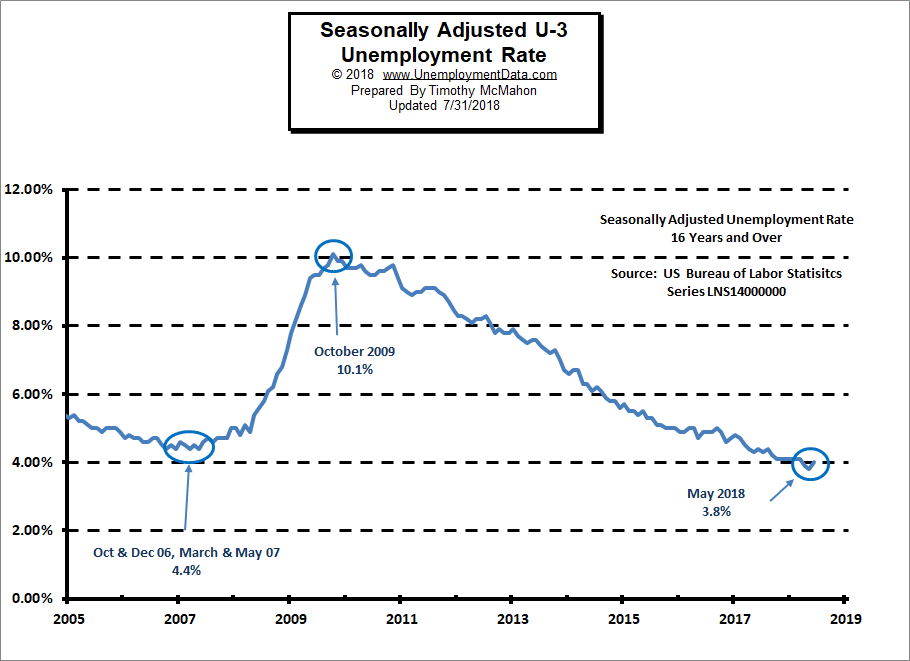
During the same period U.S. unemployment levels were considerably lower with a bottom of 4.4% (roughly 2/3rds the EU level) in October & December 2006 and again in March and May of 2007. And then we see that U.S. unemployment peaked earlier i.e. in October 2009 (compared to 2012-13 for the EU) and at a lower level 10.1% for the U.S. compared to 11.0% for the E.U. Interestingly the U.S. unemployment rate actually shot up faster in that it reached 10.1% in 2009 while the E.U. was still around 9% at that time. But then the U.S. rate turned down while the E.U. unemployment rate continued upward for another 3 years!
Currently the U.S. rate isbelow 2006-07 levels while the E.U. rate has not yet reached 2007 levels. And current U.S. levels are roughly 56% of E.U. levels.
Why are E.U Unemployment Levels So Much Higher?
This makes us ask a few questions:
- Why are U.S. unemployment levels consistently lower than E.U. levels?
- Why did U.S. unemployment levels rise faster than E.U. levels?
- Why did E.U. unemployment levels take longer to fall? [Read more…] about EU Unemployment Nearing Pre-Recession Levels


