
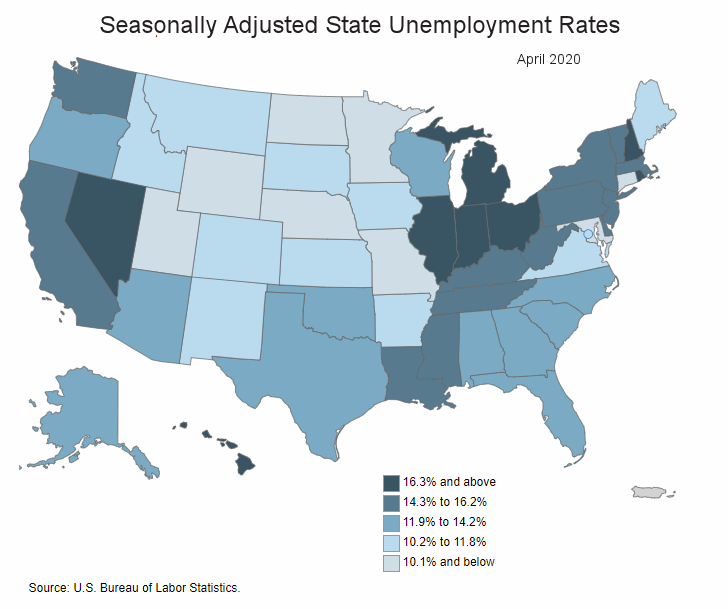
On May 22nd 2020, the U.S. Bureau of Labor Statistics released the Seasonally Adjusted Unemployment rates for each of the fifty U.S. states but “Due to the effects of the pandemic and efforts to contain the virus, Puerto Rico was not able to conduct normal data collection for its household survey in March or April 2020.”
According to the May 8th BLS data, April’s overall U.S. Seasonally Adjusted Unemployment Rate was 14.7% in today’s release we can see that some states had significantly higher rates with Nevada having 28.2% Unemployment, and Hawaii and Michigan having 22.3% and 22.7% unemployment respectively. At first blush, we might consider Hawaii and Nevada as understandable due to their high reliance on tourism but Michigan doesn’t have high tourism. And if high tourism is the cause for Hawaii and Nevada why does a high tourism state like Florida have “only” 12.9% unemployment?
By looking at the map we can see the high unemployment states are clustered in the Northeast and run down to Louisiana (which got hit with a double whammy of both the Coronavirus and falling oil prices). Other hard-hit areas are the West Coast and Hawaii.
State Unemployment Levels
The following table provides the state unemployment levels alphabetically.
| State | Unemployment Rate 4-2020 |
| Alabama | 12.9% |
| Alaska | 12.9% |
| Arizona | 12.6% |
| Arkansas | 10.2% |
| California | 15.5% |
| Colorado | 11.3% |
| Connecticut | 7.9% |
| Delaware | 14.3% |
| Florida | 12.9% |
| Georgia | 11.9% |
| Hawaii | 22.3% |
| Idaho | 11.5% |
| Illinois | 16.4% |
| Indiana | 16.9% |
| Iowa | 10.2% |
| Kansas | 11.2% |
| Kentucky | 15.4% |
| Louisiana | 14.5% |
| Maine | 10.6% |
| Maryland | 9.9% |
| Massachusetts | 15.1% |
| Michigan | 22.7% |
| Minnesota | 8.1% |
| Mississippi | 15.4% |
| Missouri | 9.7% |
| Montana | 11.3% |
| Nebraska | 8.3% |
| Nevada | 28.2% |
| New Hampshire | 16.3% |
| New Jersey | 15.3% |
| New Mexico | 11.3% |
| New York | 14.5% |
| North Carolina | 12.2% |
| North Dakota | 8.5% |
| Ohio | 16.8% |
| Oklahoma | 13.7% |
| Oregon | 14.2% |
| Pennsylvania | 15.1% |
| Rhode Island | 17.0% |
| South Carolina | 12.1% |
| South Dakota | 10.2% |
| Tennessee | 14.7% |
| Texas | 12.8% |
| Utah | 9.7% |
| Vermont | 15.6% |
| Virginia | 10.6% |
| Washington | 15.4% |
| West Virginia | 15.2% |
| Wisconsin | 14.1% |
| Wyoming | 9.2% |
States Sorted by Unemployment Level
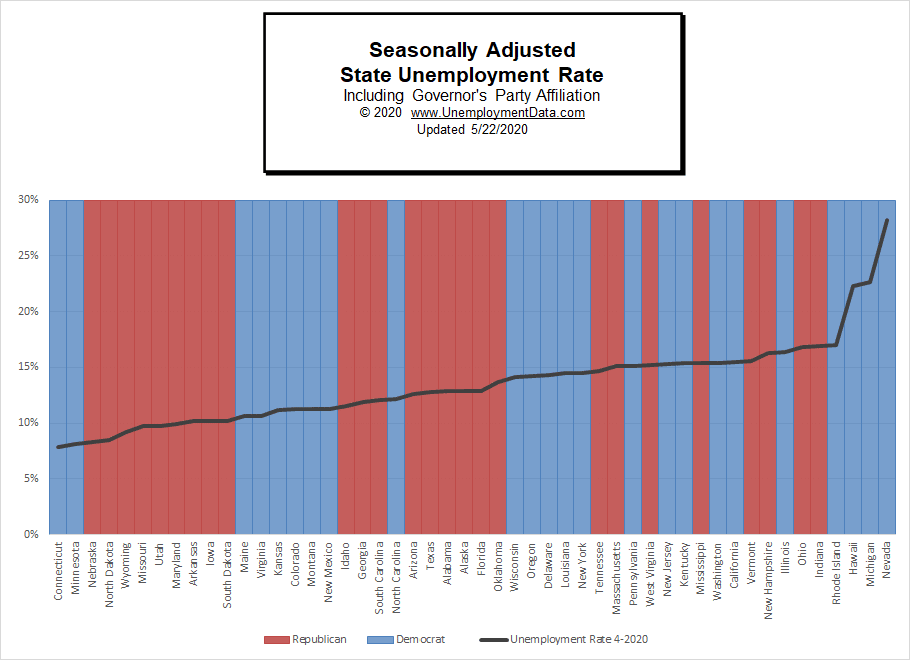
The following table is sorted by State’s unemployment rates with the lowest rates at the top. The table is also color-coded based on the political party of the Governor and State legislature. If the Governor is one party and the legislature is the other, the state is marked with a mixture of blue and red (i.e. purple). Based on this table it is a bit difficult to tell whether the political party makes a difference but it looks like there might be more red slots at the top of the table although the top two slots are blue. We can tell however that of the 27 states with less than 14% unemployment 2/3rds (i.e. 18) of them have Republican governors.
And of the remaining 23 states with unemployment above 14% unemployment 65% (i.e. 15) have Democrat Governors.
| State | Governor | State Legislature | Unemployment Rate 4-2020 |
| Connecticut | Democrat | Democrat | 7.9% |
| Minnesota | Democrat | Democrat | 8.1% |
| Nebraska | Republican | Republican | 8.3% |
| North Dakota | Republican | Republican | 8.5% |
| Wyoming | Republican | Republican | 9.2% |
| Missouri | Republican | Republican | 9.7% |
| Utah | Republican | Republican | 9.7% |
| Maryland | Republican | Democrat | 9.9% |
| South Dakota | Republican | Republican | 10.2% |
| Arkansas | Republican | Republican | 10.2% |
| Iowa | Republican | Mixed | 10.2% |
| Maine | Democrat | Democrat | 10.6% |
| Virginia | Democrat | Democrat | 10.6% |
| Kansas | Democrat | Republican | 11.2% |
| Montana | Democrat | Republican | 11.3% |
| Colorado | Democrat | Democrat | 11.3% |
| New Mexico | Democrat | Democrat | 11.3% |
| Idaho | Republican | Republican | 11.5% |
| Georgia | Republican | Democrat | 11.9% |
| South Carolina | Republican | Republican | 12.1% |
| North Carolina | Democrat | Republican | 12.2% |
| Arizona | Republican | Mixed | 12.6% |
| Texas | Republican | Republican | 12.8% |
| Florida | Republican | Republican | 12.9% |
| Alabama | Republican | Republican | 12.9% |
| Alaska | Republican | Mixed | 12.9% |
| Oklahoma | Republican | Republican | 13.7% |
| *** | *** | *** | 14% |
| Wisconsin | Democrat | Republican | 14.1% |
| Oregon | Democrat | Democrat | 14.2% |
| Delaware | Democrat | Democrat | 14.3% |
| Louisiana | Democrat | Republican | 14.5% |
| New York | Democrat | Democrat | 14.5% |
| Tennessee | Republican | Republican | 14.7% |
| Pennsylvania | Democrat | Republican | 15.1% |
| Massachusetts | Republican | Democrat | 15.1% |
| West Virginia | Republican | Republican | 15.2% |
| New Jersey | Democrat | Democrat | 15.3% |
| Mississippi | Republican | Republican | 15.4% |
| Kentucky | Democrat | Republican | 15.4% |
| Washington | Democrat | Democrat | 15.4% |
| California | Democrat | Democrat | 15.5% |
| Vermont | Republican | Democrat | 15.6% |
| New Hampshire | Republican | Democrat | 16.3% |
| Illinois | Democrat | Democrat | 16.4% |
| Ohio | Republican | Republican | 16.8% |
| Indiana | Republican | Republican | 16.9% |
| Rhode Island | Democrat | Democrat | 17.0% |
| Hawaii | Democrat | Democrat | 22.3% |
| Michigan | Democrat | Mixed | 22.7% |
| Nevada | Democrat | Democrat | 28.2% |
**********************************************
If we look at the data a bit differently…
States Sorted by Governor’s Political Party
The states with Democrat Governors and Democrat majority legislatures had a low unemployment rate of 7.9% ranging all the way up to 28.2% but they average 14.556%. Lest we think that the high numbers of Hawaii and Nevada skewed the numbers, the group with Democrat Governors with Republican-led or mixed legislatures (and no Hawaii or Nevada) still had an average that was virtually identical 14.563% (we had to carry it out to 3 decimal places to find a difference).
States with Republican Governors and Democrat legislatures did better with an average of 13.8% unemployment. States with Republican Governors and Republican legislatures had an average of 12.3% unemployment while States with Republican Governors and Mixed legislatures had an average of 11.9% unemployment.
The highest unemployment rate for a Republican Governor and a Republican legislature is Indiana with 16.9% unemployment while the highest unemployment rate for a Democrat Governor with a Democrat legislature is Nevada at 28.2% followed by Hawaii at 22.3%.
| State | Governor | State Legislature | Unemployment Rate 4-2020 | Average |
| Connecticut | Democrat | Democrat | 7.9% | 14.556% |
| Minnesota | Democrat | Democrat | 8.1% | |
| Maine | Democrat | Democrat | 10.6% | |
| Virginia | Democrat | Democrat | 10.6% | |
| Colorado | Democrat | Democrat | 11.3% | |
| New Mexico | Democrat | Democrat | 11.3% | |
| Oregon | Democrat | Democrat | 14.2% | |
| Delaware | Democrat | Democrat | 14.3% | |
| New York | Democrat | Democrat | 14.5% | |
| New Jersey | Democrat | Democrat | 15.3% | |
| Washington | Democrat | Democrat | 15.4% | |
| California | Democrat | Democrat | 15.5% | |
| Illinois | Democrat | Democrat | 16.4% | |
| Rhode Island | Democrat | Democrat | 17.0% | |
| Hawaii | Democrat | Democrat | 22.3% | |
| Nevada | Democrat | Democrat | 28.2% | |
| Kansas | Democrat | Republican | 11.2% | 14.563% |
| Montana | Democrat | Republican | 11.3% | |
| North Carolina | Democrat | Republican | 12.2% | |
| Wisconsin | Democrat | Republican | 14.1% | |
| Louisiana | Democrat | Republican | 14.5% | |
| Pennsylvania | Democrat | Republican | 15.1% | |
| Kentucky | Democrat | Republican | 15.4% | |
| Michigan | Democrat | Mixed | 22.7% | |
| Maryland | Republican | Democrat | 9.9% | 13.8% |
| Georgia | Republican | Democrat | 11.9% | |
| Massachusetts | Republican | Democrat | 15.1% | |
| Vermont | Republican | Democrat | 15.6% | |
| New Hampshire | Republican | Democrat | 16.3% | |
| Iowa | Republican | Mixed | 10.2% | 11.9% |
| Arizona | Republican | Mixed | 12.6% | |
| Alaska | Republican | Mixed | 12.9% | |
| Nebraska | Republican | Republican | 8.3% | 12.3% |
| North Dakota | Republican | Republican | 8.5% | |
| Wyoming | Republican | Republican | 9.2% | |
| Missouri | Republican | Republican | 9.7% | |
| Utah | Republican | Republican | 9.7% | |
| South Dakota | Republican | Republican | 10.2% | |
| Arkansas | Republican | Republican | 10.2% | |
| Idaho | Republican | Republican | 11.5% | |
| South Carolina | Republican | Republican | 12.1% | |
| Texas | Republican | Republican | 12.8% | |
| Florida | Republican | Republican | 12.9% | |
| Alabama | Republican | Republican | 12.9% | |
| Oklahoma | Republican | Republican | 13.7% | |
| Tennessee | Republican | Republican | 14.7% | |
| West Virginia | Republican | Republican | 15.2% | |
| Mississippi | Republican | Republican | 15.4% | |
| Ohio | Republican | Republican | 16.8% | |
| Indiana | Republican | Republican | 16.9% |
Next, we will look at a chart of the various State’s unemployment rates. We can see that 4 states have considerably higher unemployment rates than the rest.
Seasonally Adjusted State Unemployment Rate Chart
This chart of Employment levels (rather than Unemployment) from the U.S. Bureau of Labor Statistics is a bit confusing at first. The light-colored states are worse off. Brown states have lost the fewest number of jobs (the legend says -8.7% and above) meaning that they lost less than 8.7% of their jobs over the last year. While the Yellow states lost more than 16.4% of their jobs over the last year.
