
The U.S. Bureau of Labor Statistics (BLS) released its employment / unemployment report for August on September 6th, 2024.
Employment / Unemployment
![]()
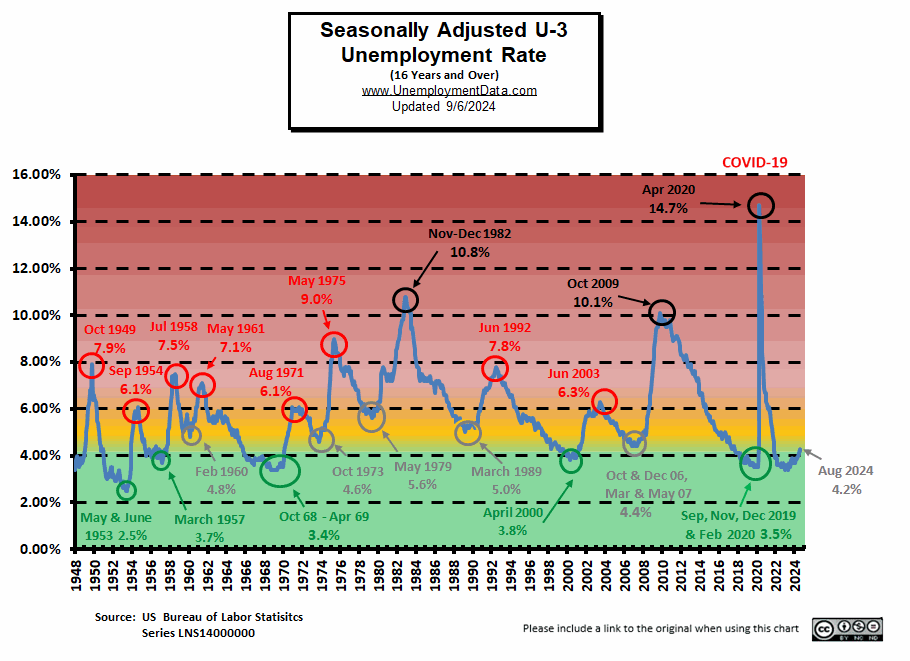
- Seasonally Adjusted U3- 4.2% down from 4.3% in July
- Unadjusted U3- 4.4% down from 4.5% in July
- Unadjusted U6- 8.0% down from 8.2% in July
- Labor Force Participation Rate 62.7% unchanged
- Employment 158.650 million up from 158.387 million
- Next data release October 4th, 2024
Summary:
Total Employed increased in August increased by 205,000 while the Civilian non-institutional population (a relatively narrow definition) increased by 212,000 over the same period so jobs didn’t even keep up with the population.
To make matters worse, jobs decreased by -947,000 in July and then the BLS announced the March 2024 Jobs numbers will be adjusted down by 818,000 in January. So, we can expect the January adjustment report to show all the numbers for 2024 to be pretty much fiction.
But… According to the Commissioner of the U.S. Bureau of Labor Statistics:
“Total nonfarm payroll employment increased by 142,000 in August, and the unemployment rate changed little at 4.2 percent, the U.S. Bureau of Labor Statistics reported today. Job gains occurred in construction and health care…
Both the unemployment rate, at 4.2 percent, and the number of unemployed people, at 7.1 million, changed little in August. These measures are higher than a year earlier, when the jobless rate was 3.8 percent, and the number of unemployed people was 6.3 million.”
You can read the full BLS report here.
As usual, they are talking about “Seasonally Adjusted Jobs”.
Looking at the Unadjusted Establishment Survey report we see…
Originally the BLS reported employment of 158.445 million for July
which they adjusted down -58,000 to 158.387 million in today’s report .
They are currently reporting 158.650 million jobs for August which is actually an increase of 205,000 jobs based on their originally reported July numbers. But still below the 159.392 million originally reported in June and not that much different than the 158.461 originally reported last November. The LFPR was unchanged from July at 62.7%.
Bad News for the Market?
The stock market peaked on August 30th and has fallen since then and the jobs report didn’t help stem the decline. After the Friday jobs report the NYSE fell another 1.14%. Our NYSE ROC chart created based on August month-end numbers showed a cross above the top line of a long-term channel and we said “The market is definitely at a point of exuberance. We can expect it to correct back down to at least the yellow Mid-Term Support.”
The current drop just brings the NYSE back within the channel, so it still has a long way to go to get to the channel mid-point.
On the geopolitical front, Hamas killed several hostages rather than let them be rescued. So the market still fears a war in the Middle East. The Japanese financial problems seem to have settled down now and the market is anticipating a FED rate cut shortly.
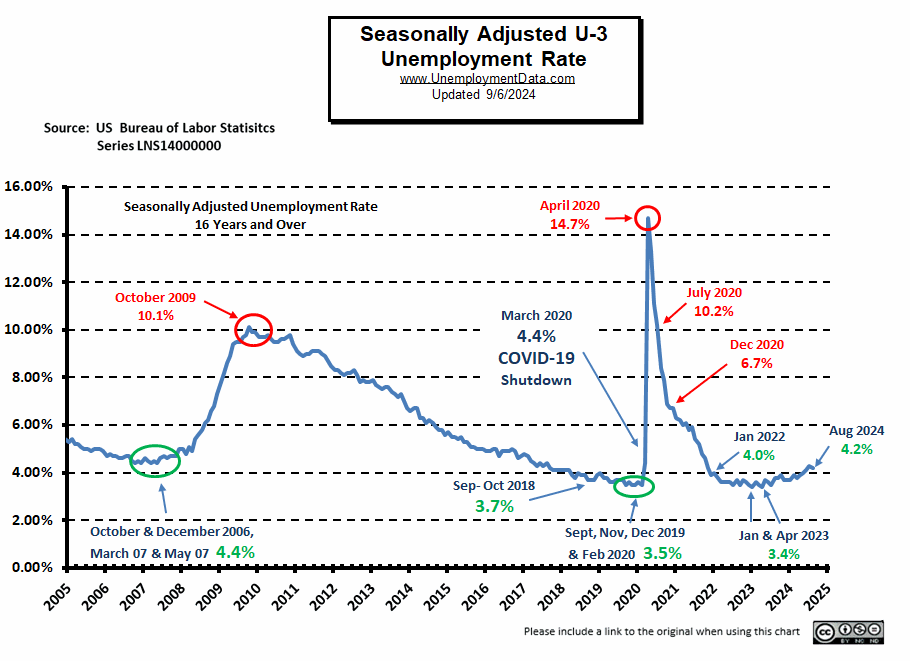
Current Unemployment Rate Chart
Seasonally Adjusted U3 Unemployment is well above the pre-COVID 2019 cyclical lows of 3.5%, but is approaching the yellow zone.
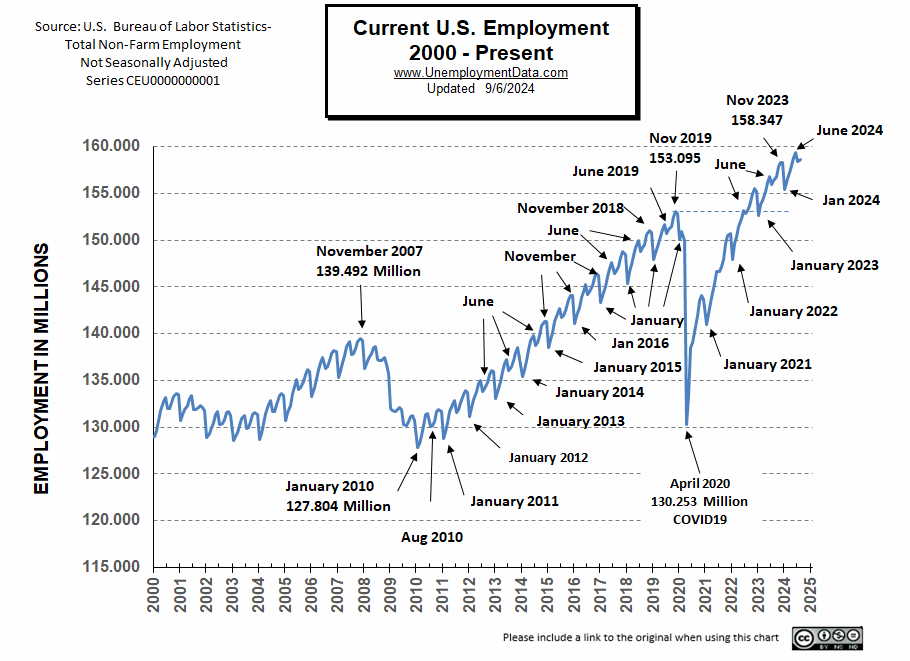
Current Employment Rate
The BLS originally reported employment in July as 158.445 million which they adjusted to 158.387 million. July was originally -947,000 less than they originally reported for June. Currently they are reporting 159.341 million for June, 158.387 million for July, and 158.650 million for August.
Employment is still 2,295,000 Above Year-Ago Levels and 9.044 million above February 2020 (prior to the Covid Crash)
However, the Civilian Population has also increased by about 9.228 million since February 2020 (probably not counting the millions of illegal aliens that have come since then). So, employment hasn’t kept up with the population increase.
See Current Employment for more information.
BLS: August 2024 Employment by Sector
The BLS employment “bubble chart” based on the Establishment Survey Data gives us a good picture of the Seasonally adjusted employment numbers.
The Bubble’s Size tells us the total Employment for that industry (i.e., larger bubbles mean more people are employed in that sector).
The bubble’s location on the chart tells us that there has been a change in Employment Levels over the most recent month… A bubble further to the right indicates larger job growth. A bubble’s vertical location on the chart shows the average industry salary.
Remember, these are Seasonally Adjusted Numbers, so they aren’t cumulative!
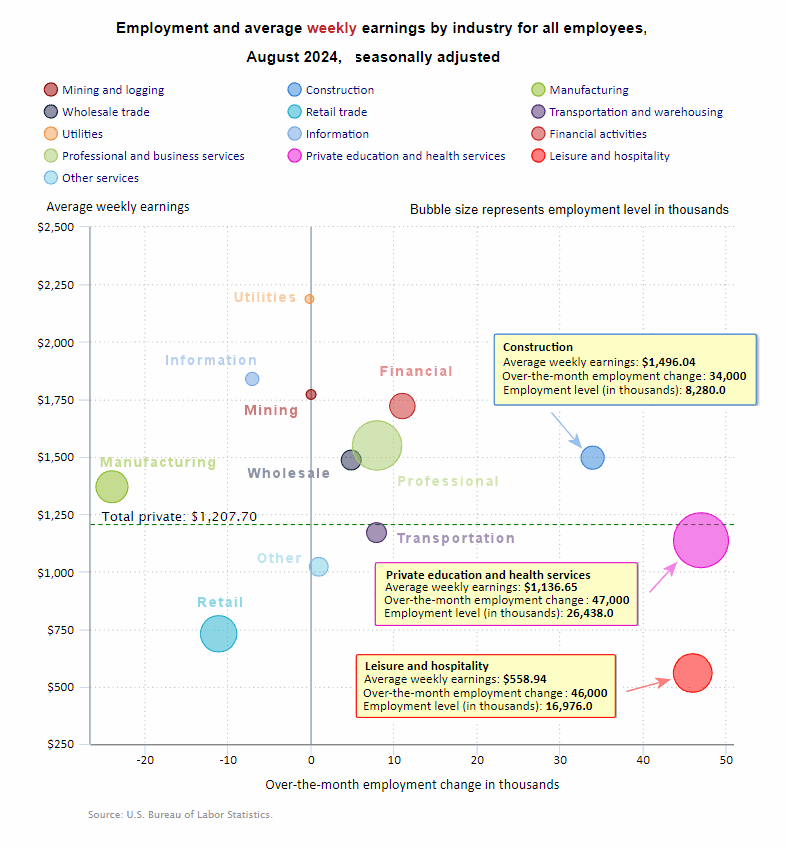
Looking at the above chart we can see three sectors were virtually unchanged and three sectors fell. There are more bubbles to the left of the zero line than we have seen recently, with Manufacturing losing the most jobs.
Education and Health added 47,000 jobs in August, Leisure and Hospitality Services added 46,000 jobs and Construction added 34,000 jobs. Wages rose after falling in July.
BLS Average Weekly Wages
| Date | Average Weekly Wage |
| August 2024 | $1,207.70 |
| July 2024 | $1,199.39 |
| June 2024 | $1,200.50 |
| May 2024 | $1,197.41 |
| April 2024 | $1,191.93 |
| March 2024 | $1,193.34 |
| February 2024 | $1,185.75 |
| January 2024 | $1,178.16 |
| December 2023 | $1,175.46 |
| November 2023 | $1,173.04 |
| October 2023 | $1,166.20 |
| September 2023 | $1,165.47 |
| August 2023 | $1,163.41 |
| July 2023 | $1,157.28 |
| June 2023 | $1,155.15 |
| May 2023 | $1,146.99 |
| April 2023 | $1,147.58 |
| March 2023 | $1,141.34 |
| February 2023 | $1,141.61 |
| January 2023 | $1,146.14 |
| December 2022 | $1,125.73 |
| November 2022 | $1,129.01 |
| October 2022 | $1,124.01 |
| September 2022 | $1,119.87 |
| August 2022 | $1,116.42 |
| July 2022 | $1,116.54 |
| June 2022 | $1,106.76 |
| May 2022 | $1,105.47 |
| April 2022 | $1,102.01 |
| December 2021 | $1,086.46 |
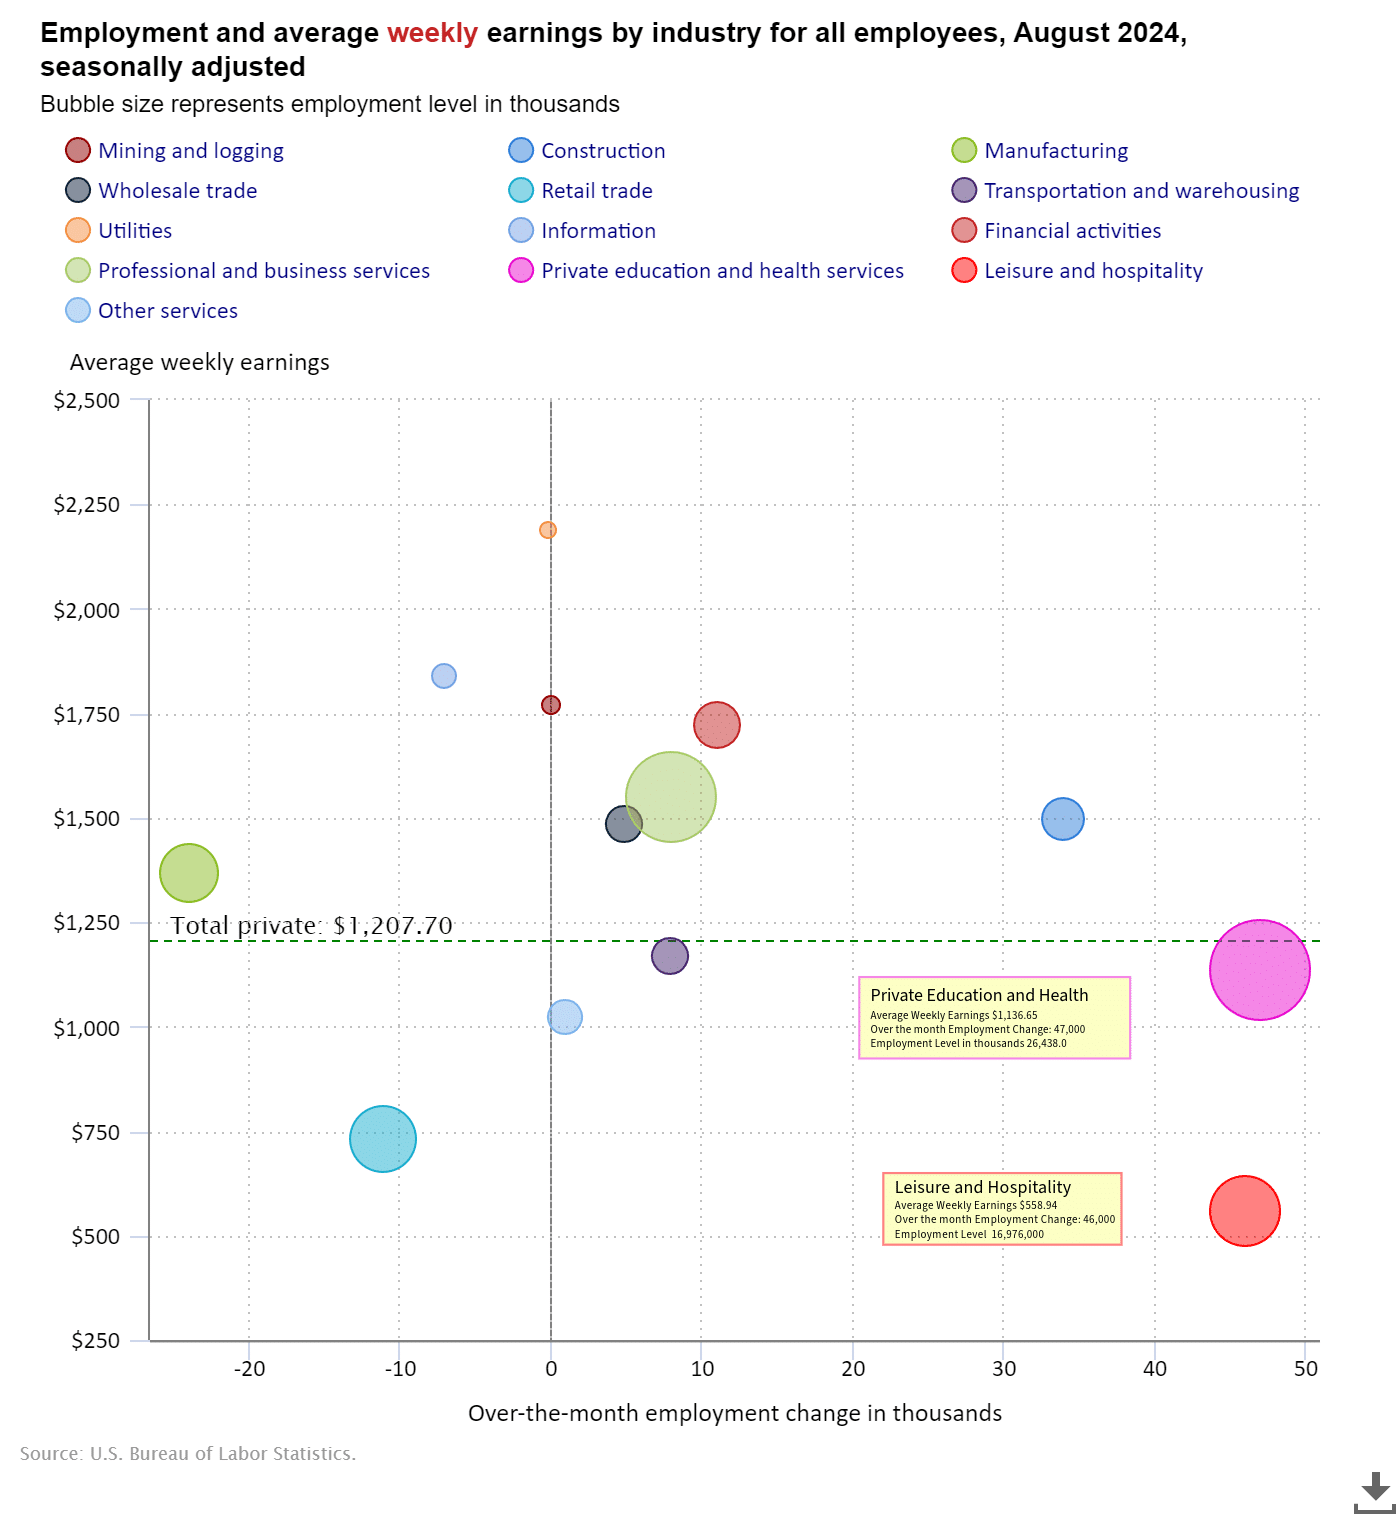
BLS Employment and Average Weekly Earnings by Industry
August 2024, Seasonally Adjusted Employment
Note that due to “seasonal adjusting,” although they may claim that there was a “monthly increase” (or decrease), there isn’t always an actual increase; you can’t just subtract last month’s “employment level” from this month’s level. For instance, Mining employment was supposed to have been flat in August. But July had 633,000 and August had 635,000 which looks like a 2,000 job increase. And Construction went from 8,260,000 to 8,280,000 which looks like a 20,000 job increase but due to adjusting it is a 34,000 increase.
| Industry | Monthly Increase | August Ave. Weekly Earnings | August Employment Level | July Employment Level |
| Total Private Employment | 118,000 | $1,207.70 | 135,440,000 | 135,384,000 |
| Mining and Logging | 0 | $1,771.07 | 635,000 | 633,000 |
| Construction | 34,000 | $1,496.04 | 8,280,000 | 8,260,000 |
| Manufacturing | -24,000 | $1,369.60 | 12,927,000 | 12,953,000 |
| Wholesale trade | 4,900 | $1,485.77 | 6,182,000 | 6,177,200 |
| Retail trade | -11.100 | $729.73 | 15,650,400 | 15,676,300 |
| Transportation and Warehousing | 7,900 | $1,170.02 | 6,624,400 | 6,635,900 |
| Utilities | -200 | $2,186.57 | 589,700 | 589,500 |
| Information | -7,000 | $1,838.78 | 2,993,000 | 2,996,000 |
| Financial Activities | 11,000 | $1,720.88 | 9,258,000 | 9,241,000 |
| Professional and Business Services | 8,000 | $1,549.06 | 22,975,000 | 22,992,000 |
| Private Education and Health Services | 47,000 | $1,136.65 | 26,438,000 | 26,390,000 |
| Leisure and Hospitality | 46,000 | $558.94 | 16,976,000 | 16,926,000 |
| Other Services | 1,000 | $1,021.38 | 5,911,000 | 5,914,000 |
Source: BLS
ADP® National Employment Report
ADP provides an independent (non-government) estimate of private-sector employment and pay, based on data derived from ADP client payrolls. According to ADP®, In collaboration with Stanford Digital Economy Lab.
ADP: Private employers added 99,000 jobs in August
(This was less than the BLS Seasonally adjusted estimate of 118,000 )
- The labor market continued to cool in August. Job creation among private employers slowed for the fifth straight month and wage growth was stable.
Source: ADP®
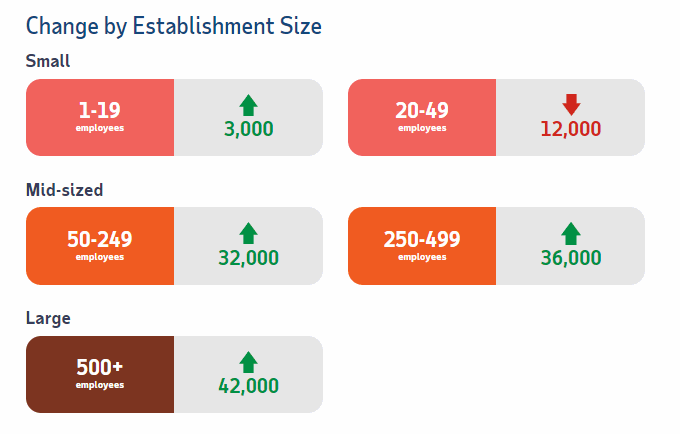
ADP Private Employment by Establishment Size
As we can see from the graphic below most establishment sizes had positive gains. The only sector that declined slightly were those establishments with 20-49 employees which is a similar pattern to last month.
August ADP Changes:
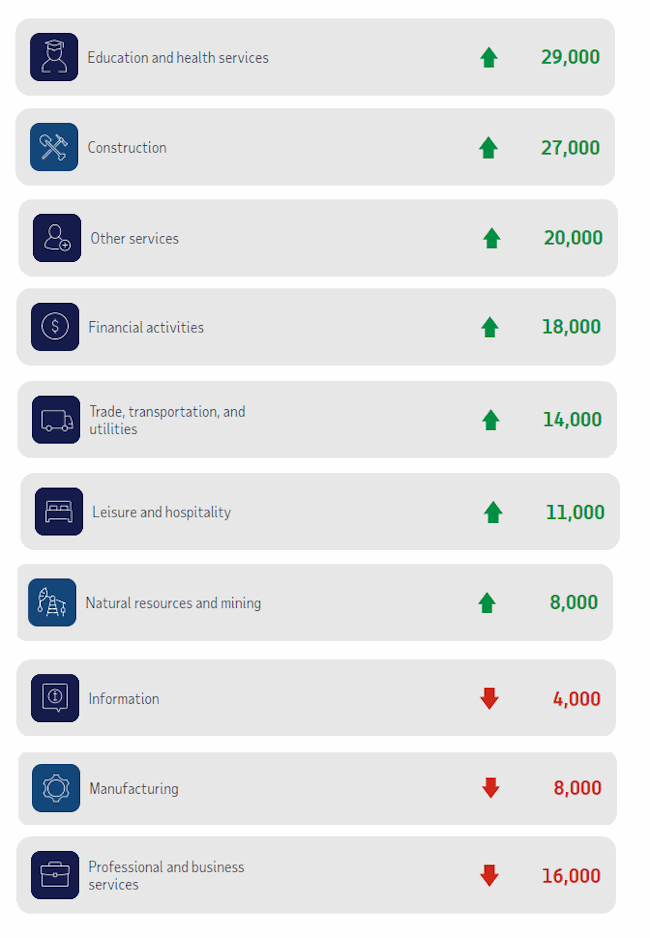
 ADP Job Gainers / Losers
ADP provides an entirely different picture of the job situation compared to the BLS perspective. For instance while the ADP says Transportation gained 61,000 jobs, BLS says they gained 14,000 jobs. This may be due to slightly different classification and groupings of jobs.
Unemployment
August’s Seasonally Adjusted Unemployment is down from 4.3% to 4.2%.
Labor Force Participation Rate
Surprisingly, the LFPR is unchanged at 62.7%.
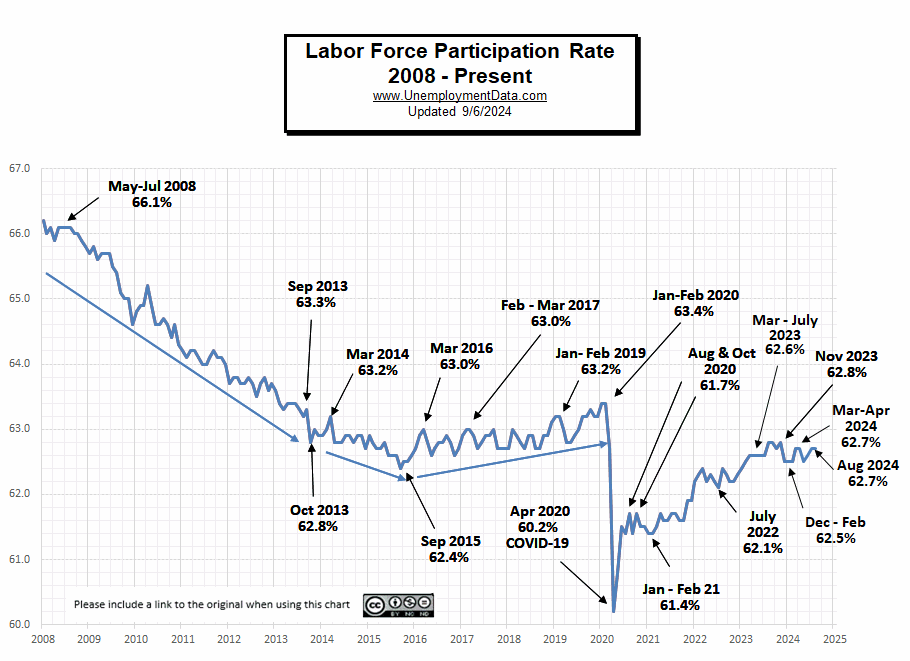 See Labor Force Participation Rate for more information.
Less Than Full Employment
This chart compares employment levels with the (inverted) unemployment rate.
Full Employment is when everyone who wants a job has one. It is generally considered to be around 3%. After the unemployment rate almost touched the magic full employment line in April 2023, it began moving away (i.e., higher unemployment).
Note: The Unemployment rate is inverted to track the employment rate. Neither is Seasonally Adjusted. For more information see Employment vs. Unemployment.
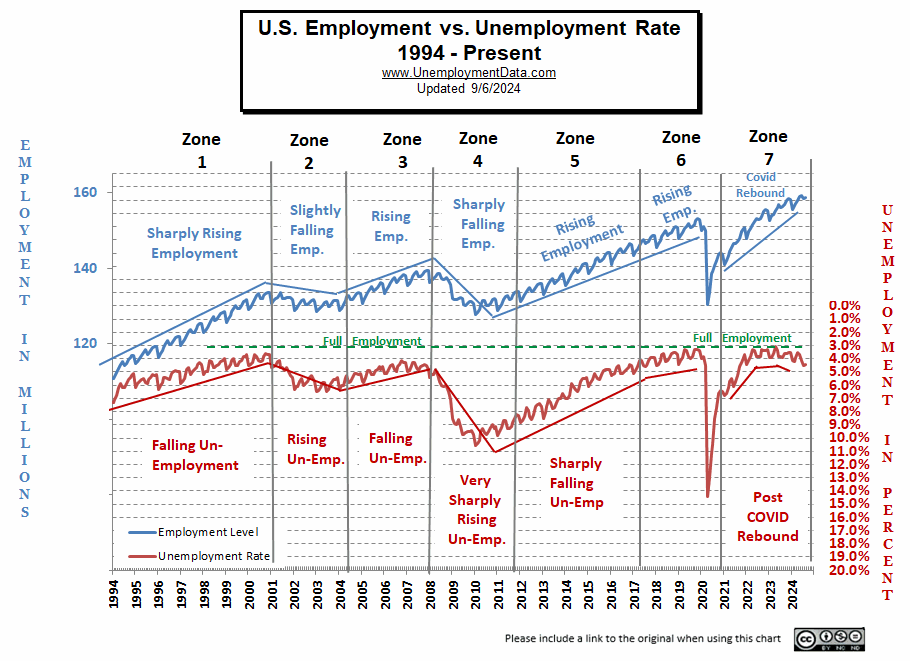
Note: Full employment is not considered to be at zero percent because even when employers are having difficulty finding employees, some people are still unemployed due to either:
- structural unemployment (mismatch between worker skills and job requirements, i.e., not enough training) or
- frictional unemployment There will always be people who have quit or have lost a seasonal job and are in the process of getting a new job. Or
- Simply because they quit their job knowing it would be easy to find another (hopefully better) job.
Seasonally Adjusted U1 through U6 Unemployment Rates
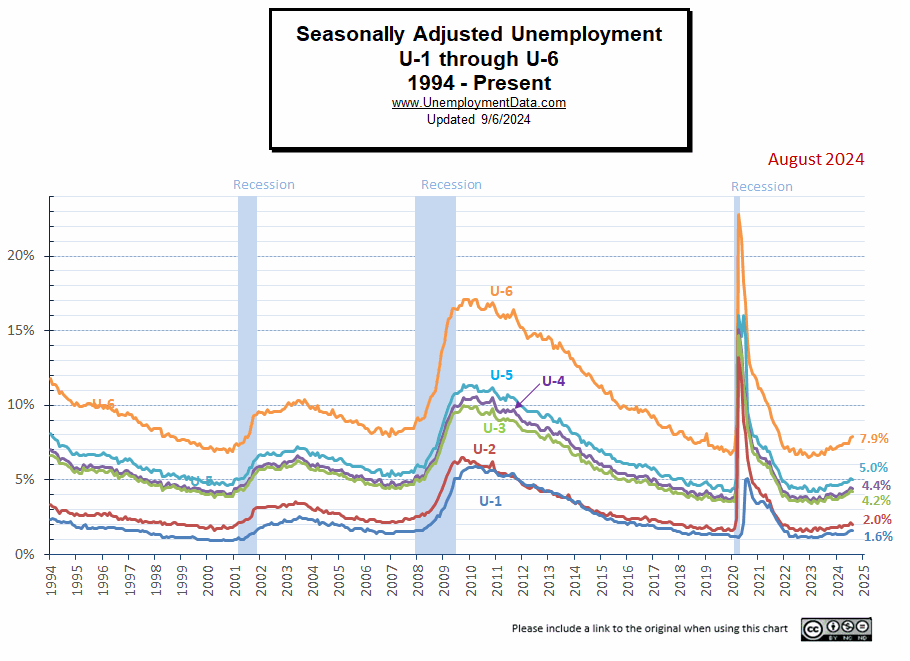 For more information about the various measurements of unemployment, see What Is U-6 Unemployment?
Seasonally Adjusted Unemployment by Education
This chart does refute the idea that getting a college education doesn’t help you find a job. Those with a 4 year degree have half the unemployment level than someone with only a High School diploma. But it doesn’t show whether they are “underemployed” i.e. working as a Barista at Starbucks or flipping burgers at McDonalds. And these numbers only apply to people over the age of 25 (so they have had some time to settle in).
This month those with less than a High School Diploma showed a sharp increase from 6.7% to 7.1%. Sharp increases in this demographic are typical in the early stages of a recession. Surprisingly, High School graduate unemployment actually decreased sharply from 4.6% to 4.0%. So, perhaps grads took the jobs of those without High School? Those with some college declined slightly from 3.5% to 3.4% while those with college rose slightly from 2.3% to 2.5%.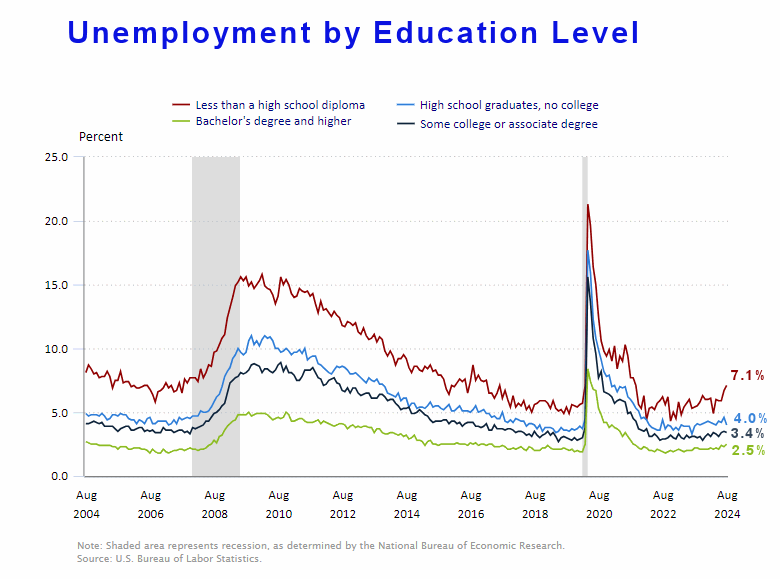
Source: BLS
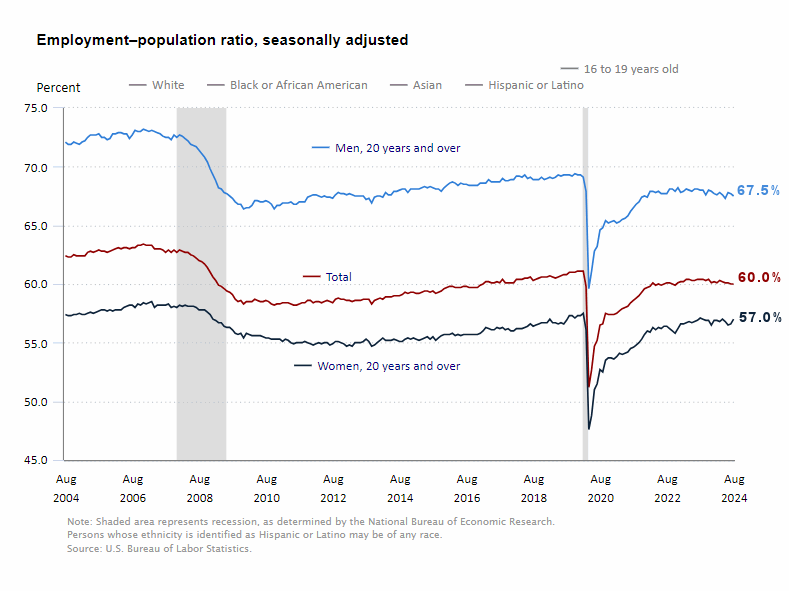
Employment-Population Ratio
This charts shows the Employment-Population Ratio by gender. Showing that Men make up a much larger portion of the workforce, i.e., 67.5% of men are employed (compared to 67.7% last month) and only 57.0% of women are employed (up from 56.6% last month). But…
As you can see 20 years ago, back in 2004, almost 72% of men were working and 57% of women were working. In 2008 the Great Recession caused a massive decline in employment for both men and women. By December of 2009, only 66.4% of men were working and 55.4% of women. Over the next decade, women workers rebounded to 57.5% but men only rebounded to 69.3%.
Now less than 68% of men are working and 57% of women are working, so it isn’t women who have left the workforce but men. Perhaps there are more stay-at-home Dads because their wives could earn more? Or more men decided to retire in 2009 and 2020, rather than bother returning to the workforce.
 Read more on UnemploymentData.com.
- BLS Erases 800,000 Jobs
- July Jobs Report Spooks Stock Market
- Opportunities You Can Find With a CDL License
- Why Consumer Sentiment Fell To A Seven-Month Low
From InflationData.com
- Optimize Your Finances as Inflation Cools
- July 2024 Annual Inflation Falls Again
- What Causes Stagflation?
- Inflation Causes Inequality
- Navigating High Inflation: Should You Buy, Sell, or Hold Off on Real Estate?
- Annual Inflation Falls Below 3%
- Inflation’s Hidden Impact on Healthcare: What’s Driving Costs Up?
- The Death of the PetroDollar
From Financial Trend Forecaster
- NYSE ROC
- NASDAQ ROC
- Crypto ROC – BTC and ETH
- Are Price Controls a Good Idea?
- Modern Monetary Theory (MMT)
- Canada’s Economic Crisis
- Crypto: Crash or Opportunity?
- Bureaucracy: The Red Tape that Prevents Economic Growth
- How Washington and the Fed Caused the Commercial Real Estate Crisis
- The Results Are In: Free Market Capitalism Improves Lives
- Gold Prices: The calm before a record run
- This Trend Will Likely Soon Rock the U.S. Financial System
- Elliott Wave Analysis of Bitcoin
- Is a China-Taiwan Conflict Likely? Watch the Region’s Stock Market Indexes
- What New York City’s Art Auctions Tell You About the Stock Market — and Social Mood
From OptioMoney
- Consumer Culture Contrasting Spending Habits in the US and Europe
- Financial Considerations When Moving to Florida
- Splitting Your Golden Years:
- Home-Buying Guide for Newlyweds
- Smart Ways to Save for a Rainy Day Fund
From Your Family Finances